IoT Sensor Configuration(e.g. Indoor environmental monitoring sensors)
Overview
Purpose
This guide provides a configuration process for connecting IoT sensors to the Neuron platform, using indoor air quality monitoring equipment as an example. By following the steps to complete device network joining, data parsing, monitoring dashboard construction, and alert rule configuration, you can achieve real-time monitoring of key indicators (temperature, humidity, CO₂, etc.) in spaces like meeting rooms. This enables timely awareness of environmental conditions and proactive alerts, effectively safeguarding occupant health and visually demonstrating the value of environmental monitoring services.
Target Audience
-
Field Installation Engineers: Responsible for the technical integration of IAQ devices with the platform.
-
Property Operation and Maintenance Teams: Responsible for daily device status checks and alarm response.
-
Building Owners/Tenant Service Managers: Provide environmental quality reports to clients, enhancing service experience.
Scope and Use Case
Configuration of Milesight AM series IAQ sensors for building air quality monitoring, including gateway deployment, data access, monitoring dashboard creation, and device anomaly alerts.
Prerequisites
-
Device Readiness: Ensure IAQ devices are physically installed and powered on normally. LoRaWAN gateways are correctly deployed, configured, and have good signal coverage.
-
Platform Permissions: You need to have project administrator permissions and visibility permissions for the applications mentioned below. Please contact your system administrator or project lead to confirm your account permission scope.
-
Platform Configuration:
- Project already created in Neuron: Device integration, energy data management, monitoring dashboard creation, and device anomaly alert configuration all need to be completed within the project.
- Location structure (building, floor, room, etc.) for the project already configured: If physical location association is needed during device integration, configure the location information in the project in advance.
- Necessary application modules already installed: Such as IoT Hub, Twins Builder, Building Insight & FDD, etc.
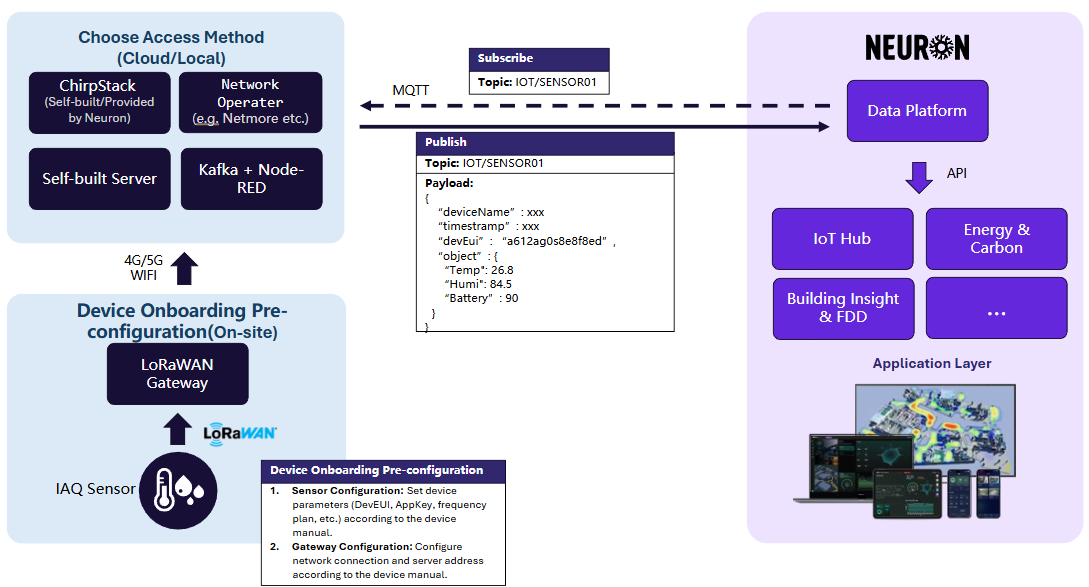
System Data Flow
The diagram below illustrates the complete data flow and key configuration points for integrating a LoRaWAN device (IAQ sensor) into the Neuron platform:
Implementation Guide
Phase 1: IAQ Device Integration into Neuron Data Platform
1. Confirm Access Method and Complete Device Network Joining and Decoding
- Expected Outcome: Once the IAQ device successfully completes network access authentication and data decoding on your chosen platform such as ChirpStack, Netmore, NodeRED (kalfa), or your self-built MQTT Server (depending on your deployment environment), you can view the device's online status and the decoded raw data in the console of the corresponding platform.
- Documentation Link:
- LoRaWAN Devices (ChirpStack): If your devices are planned to access via a self-built or Neuron-provided ChirpStack network server. 【ChirpStack Pre-configuration Guide】. If using Milesight devices and connecting via ChirpStack, you may refer to the【UG56 Gateway Configuration Guide】 / 【IAQ Device Configuration Guide】。
- LoRaWAN Devices (Netmore): If your devices access via the Netmore operator network. 【Netmore Pre-configuration Guide】.
- Data Stream Integration (Node-RED): If you need to forward existing device data from message queues like Kafka to this platform using a low-code approach. 【Kafka Pre-configuration Guide】.
- Self-built MQTT Server: If none of the above three options meet your device access plan, you can refer to the [Self-built MQTT Server Access Guide].
2. Integrate the Device into the Neuron Data Platform Based on the Chosen Access Method
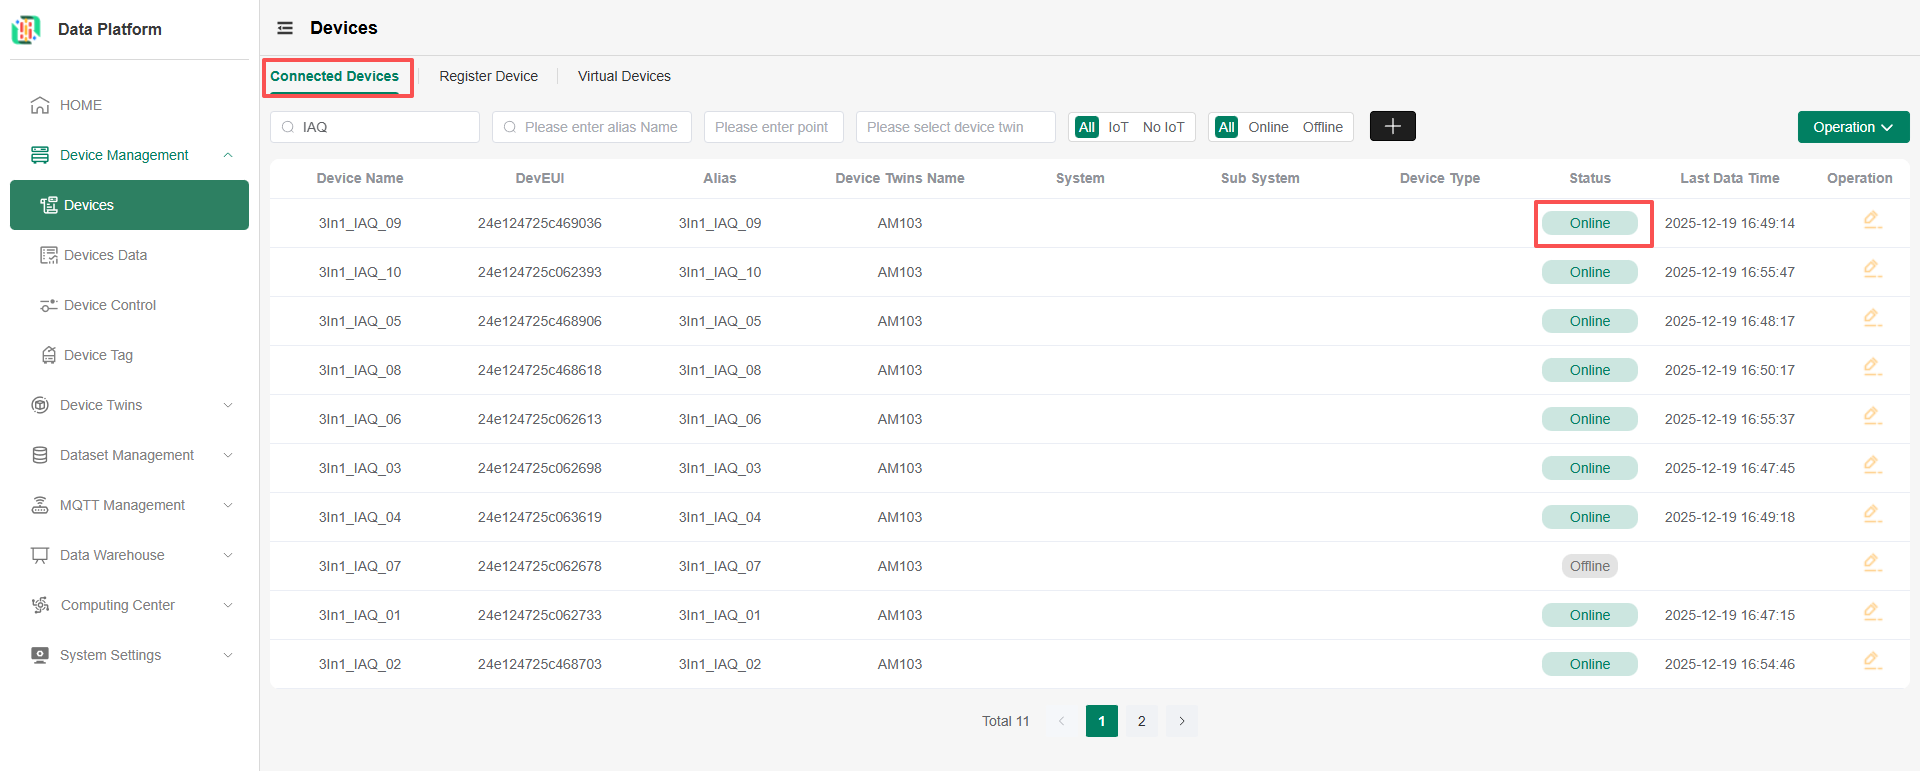
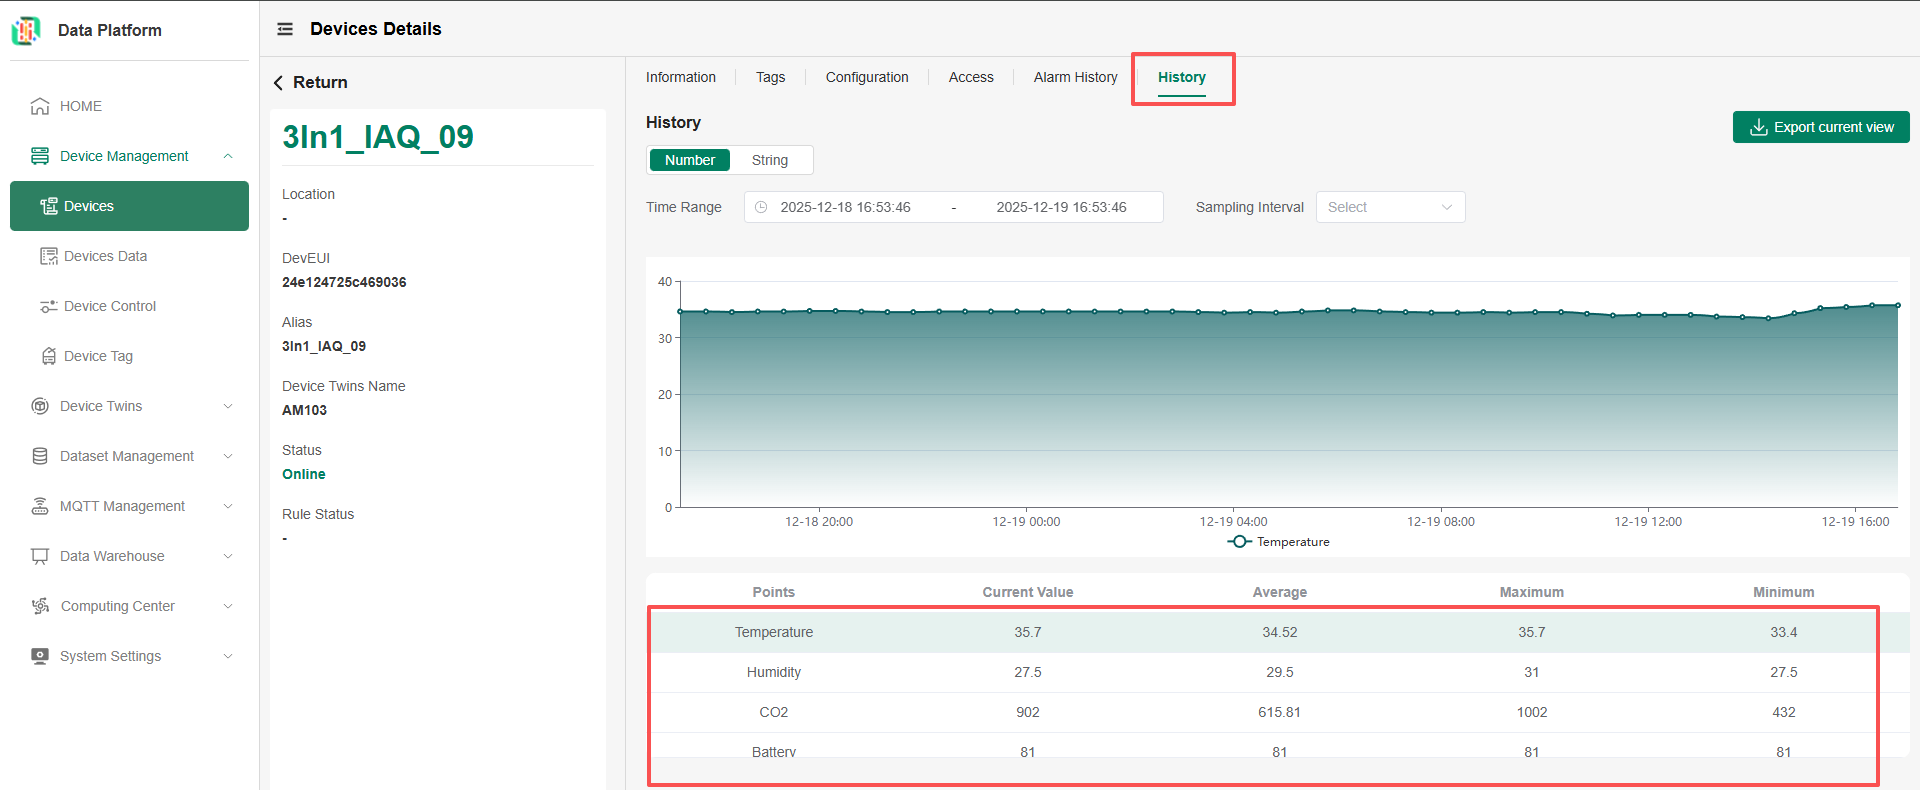
- Expected Outcome: After successfully adding a device via Data Platform → Device Management → Add Device and configuring it correctly according to the tutorial, once the device data is reported to the platform, it will appear in the Device List with a status of "Online". You can then view real-time sensor data (such as temperature, humidity, CO₂ values) on the device details page.
- Documentation Link: Device Access / Device List
- Troubleshooting:
- The device fails to connect or shows an "Offline" status in the Neuron Data Platform.
- Case 1: The device is not reporting data normally to the decoding platform.
- Cause: Communication failure between the device and the gateway, or the device failed to join the network successfully.
- Operation: Check the device signal strength, confirm the gateway is online, and verify the device activation status and uplink logs in the network server. For details, please refer to the device manual.
- Case 2: The device is physically operating normally, and data can be confirmed as normally reported in the decoding platform, but the Neuron platform fails to receive, parse, or process the data stream forwarded from the network server.
- Cause A: There is a delay in data forwarding from the network server to the platform, or the platform's data processing pipeline has not yet completed cleaning, parsing, and storing the data for this device.
- Operation A: Wait for a period of time and refresh the device list; confirm in the network server console that data has been forwarded to the correct endpoint.
- Cause B: Incorrect communication link or data parsing configuration on the platform side.
tipYour device will send data through an MQTT Server. The Neuron Data Platform will subscribe to device data based on the MQTT Server and Topic you configure. Therefore, you need to first correctly configure the MQTT Server and Topic you are using. The Payload in the Topic must contain real-time data for each point of the device. Please ensure that the point names (name) in the Payload match the Function Type names in the Neuron platform's Device Twins (case-insensitive); otherwise, the platform will not recognize the corresponding data.
- Operation B:
- Check the communication link: Go to [Data Platform → MQTT Management], verify the Broker address, port, and SSL/TLS certificate configuration to ensure they are completely consistent with the forwarding settings of the network server (e.g., Netmore/ChirpStack). For detailed operations, please refer to the relevant guide.
- Verify data routing: In [Data Platform → MQTT Management → Topic], confirm that the Topic subscribed by the platform (e.g.,
client/your-client-id/#) exactly matches the forwarding Topic configured in the network server. - Validate data parsing: Check the parsing rules in the [Data Platform → System Settings → ETL Converter] or the thing model to ensure they can correctly parse the Payload format reported by the device.
- Verify the Device Twins configuration: Navigate to 【Data Platform → Device Twins】 and confirm that the correct Device Twins has been created for this device type, and that the function points (such as temperature, humidity) in the Device Twins match the field names in the data reported by the device.
- Case 1: The device is not reporting data normally to the decoding platform.
- The device fails to connect or shows an "Offline" status in the Neuron Data Platform.
Glossary:
1. MQTT: A lightweight Internet of Things (IoT) communication protocol based on the publish-subscribe pattern, suitable for IoT device data transmission in low-bandwidth, high-latency scenarios.
2. Topic: In the MQTT protocol, a Topic is a UTF-8 string used for addressing and filtering messages. It acts as a virtual message channel between the message publisher and subscriber, serving as the core mechanism for message routing.
3. ETL Converter: A core component in the data center that transforms the diverse, non-standard data formats reported by devices into a standardized data format that the platform can uniformly recognize and process.
4. Device Twins: In the Neuron platform, a collection of devices that share the same capabilities or characteristics is referred to as a Device Twin. For example: Indoor Environmental Monitoring Sensor -> can define a Device Twin as IAQ, with Function types (data points) including Temperature / Humidity.
Phase 2: Create Monitoring Dashboards
If you need to customize data display views, you can create dedicated monitoring dashboards through the IoT Hub application to achieve data visualization, real-time alerts, and centralized device status monitoring.
1. Create a Workspace
- Expected Outcome: Enter IoT Hub and create a new workspace (e.g., "XX Building Meeting Room Air Monitoring" or "Tenant Environmental Quality Dashboard") for centrally displaying IAQ device data for specific areas or business units.
- 文档链接:IoT Hub Workspace Management
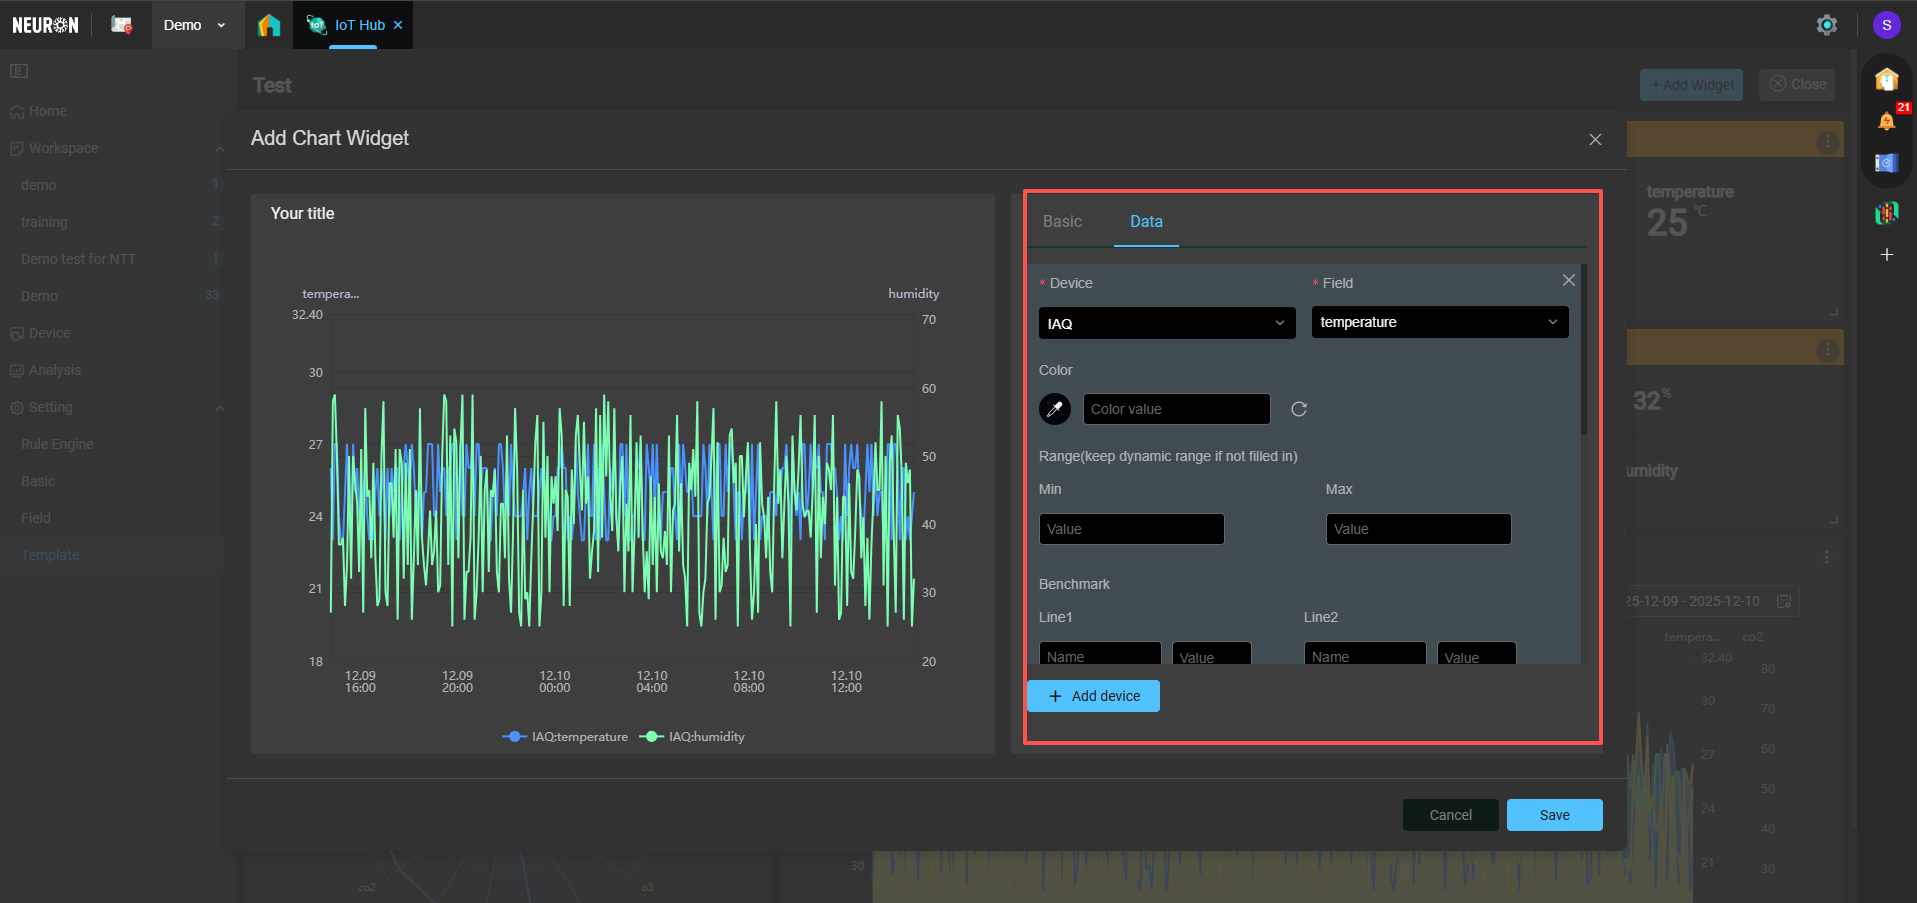
2. Configure Data Dashboard
- Expected Outcome: Add chart components (e.g., line charts, gauges, value cards); bind device data points (e.g., temperature, humidity, CO₂). You can intuitively see real-time data curves or statuses of various IAQ devices through the charts.
- Troubleshooting:
- Device successfully integrated and reporting data in the data platform, but cannot be viewed in IoT Hub.
- Case 1: Device not synchronized to IoT Hub.
- Cause: For newly configured devices, IoT Hub has not automatically completed data synchronization.
- Action: Go to the IoT Hub > Device Management page, click the "Sync Devices" button to manually trigger device list update.Refer toIoT Hub Device Management。
- Case 2: Device not marked as "is_iot".
- Cause: Some devices (e.g., BMS devices accessed via MQTT) may not be marked as IoT devices, causing IoT Hub to fail to recognize them.
- Action: You need to delete the device in the data platform and re-integrate it. During integration, ensure the
is_iotfield is enabled.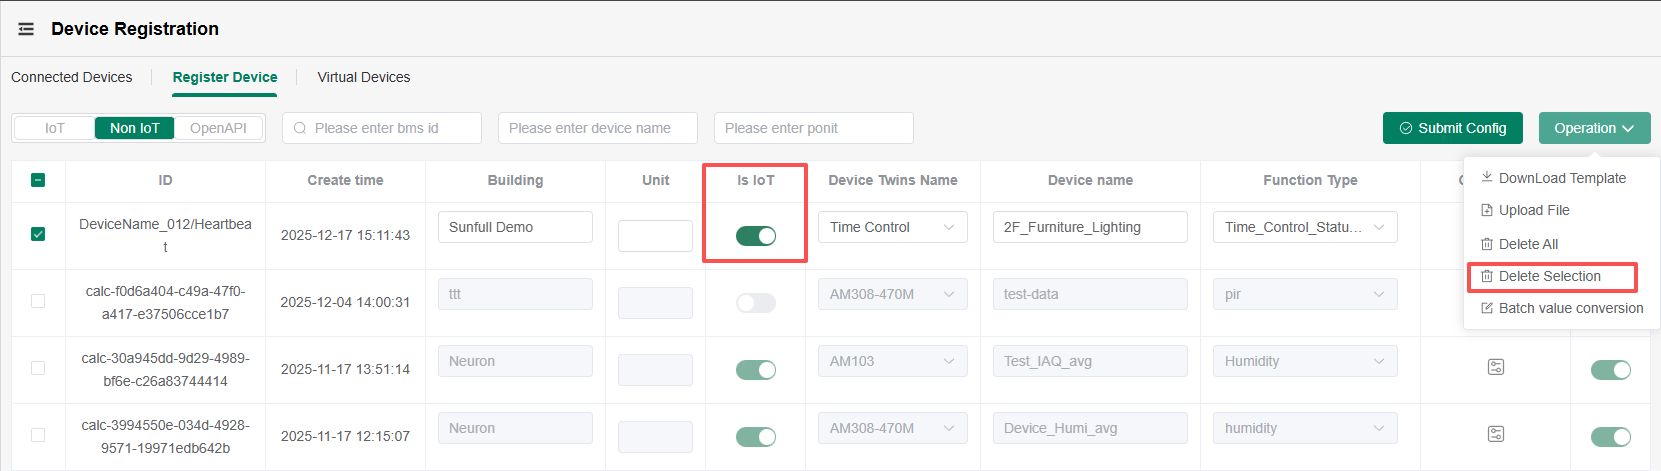
- Case 1: Device not synchronized to IoT Hub.
- Device successfully integrated and reporting data in the data platform, but cannot be viewed in IoT Hub.
- Documentation Link: Configure Dashboard
Phase 3: Configure Device Anomaly Alerts
1. Configure Rules in the Rule Engine
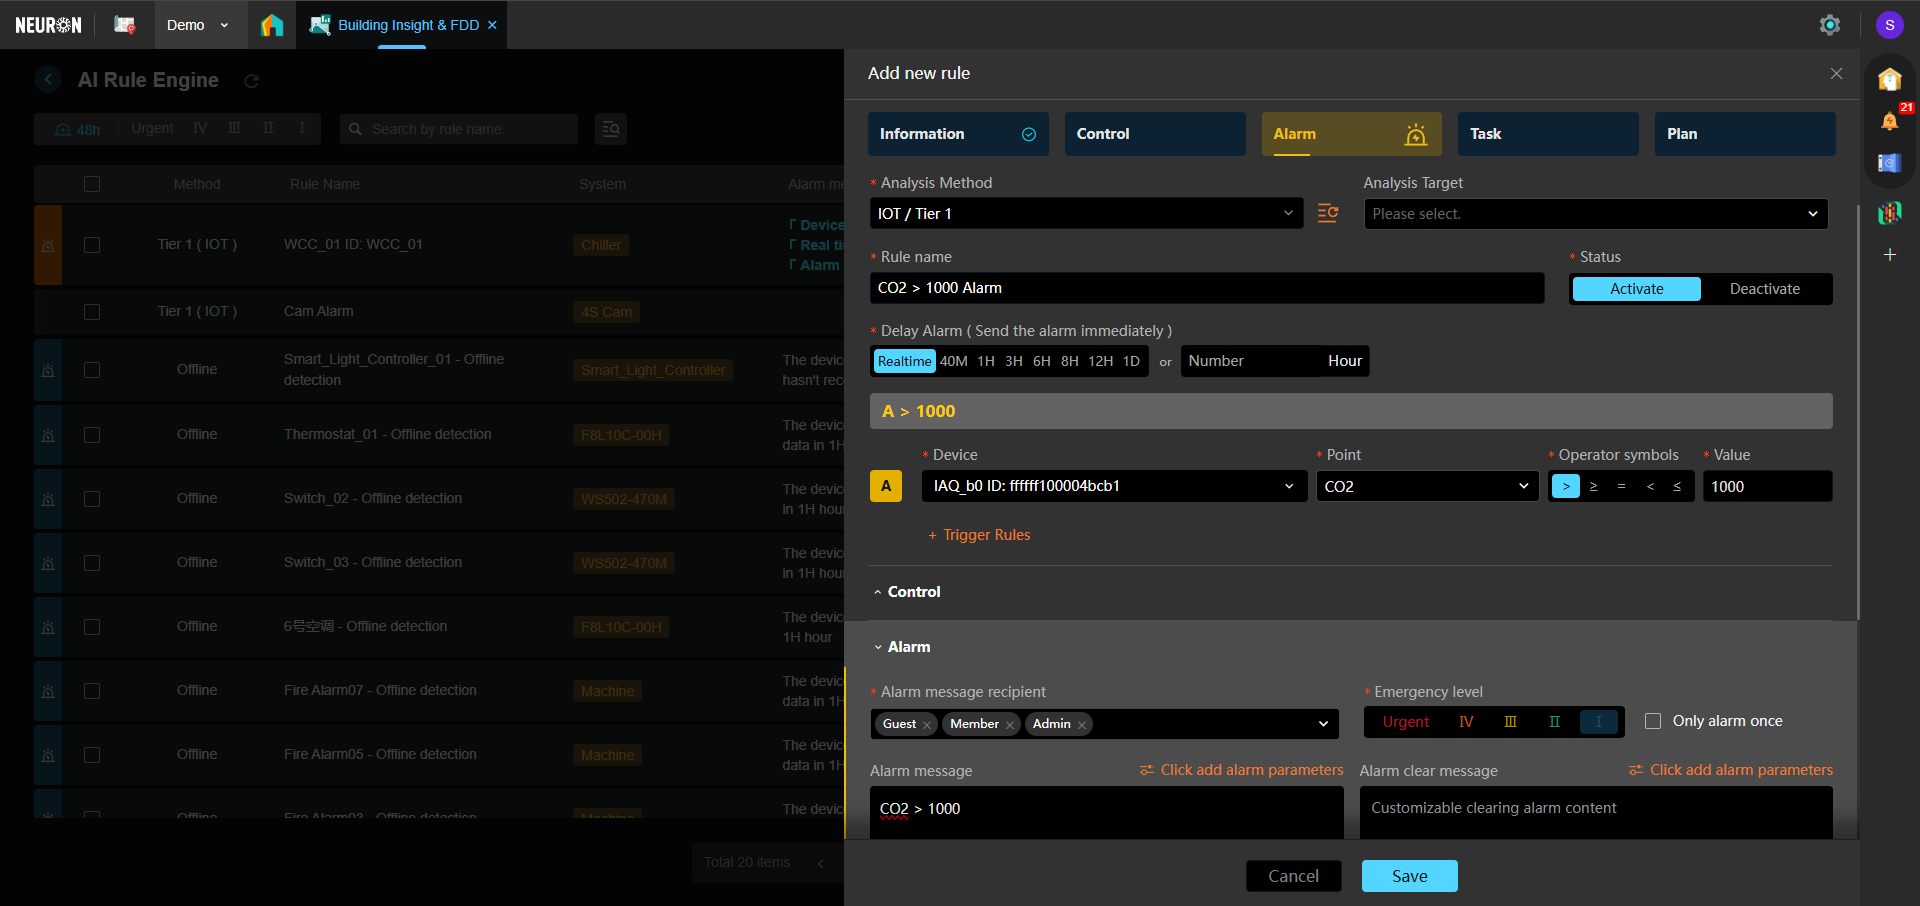
- Expected Outcome: Enter the Building Insight & Fault Detection and Diagnosis (Building Insight & FDD) application. Create a rule (e.g., "CO₂ Exceedance Alert"). When monitoring data exceeds a set threshold (e.g., CO₂ > 1000ppm), the system can automatically trigger notifications (e.g., send platform notifications/emails).
- Troubleshooting:
- Devices not visible in the Rule Engine.
- Cause: For newly configured devices, data synchronization has not yet completed in the rule engine.
- Action: Enter Building Insight & FDD, click the "Sync Data" button to manually trigger device data synchronization.
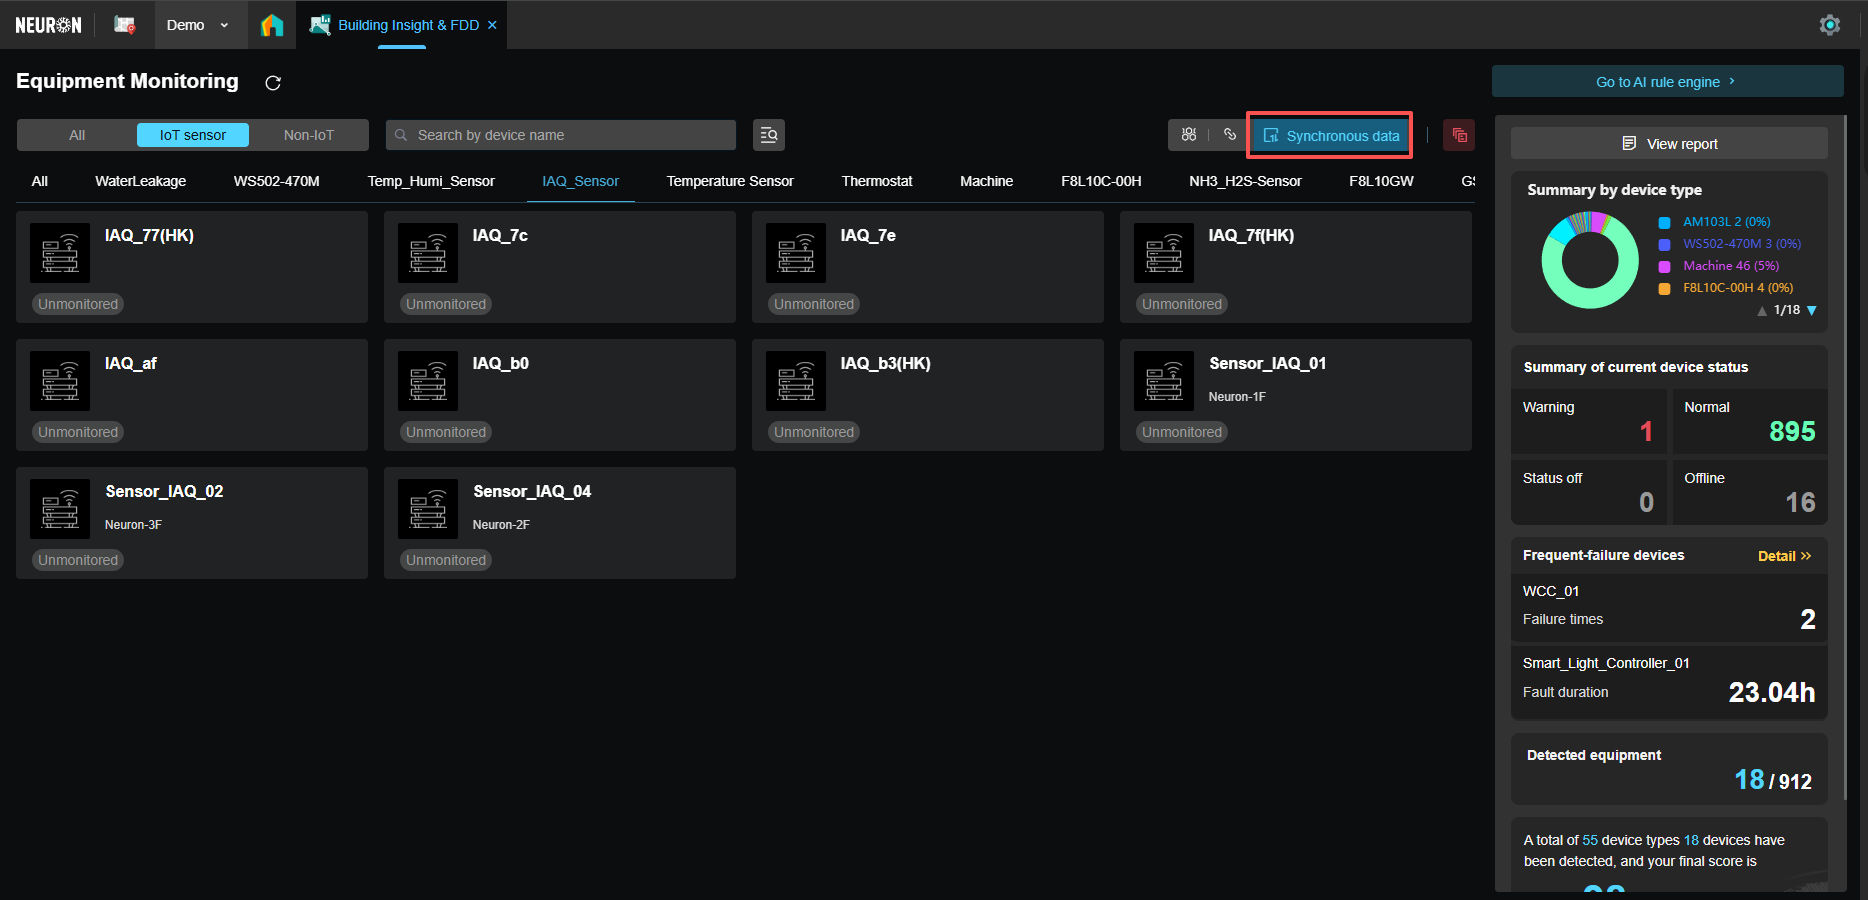
- Devices not visible in the Rule Engine.
- Documentation Link: Rule Engine
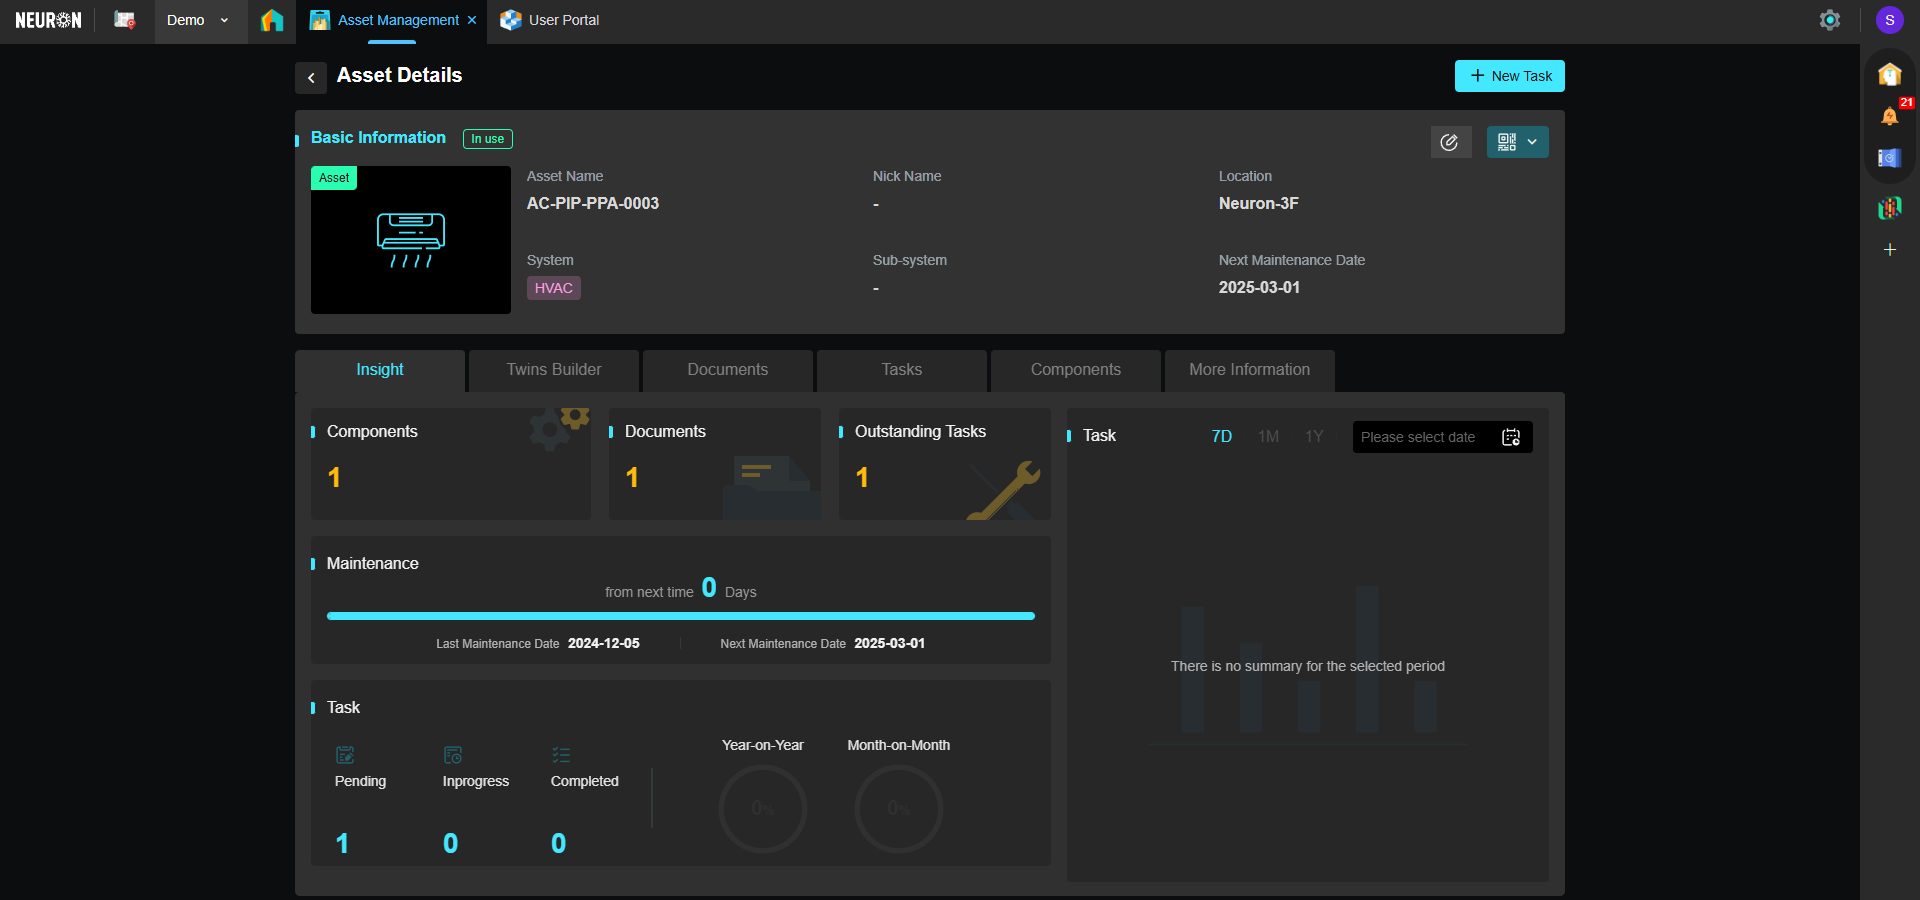
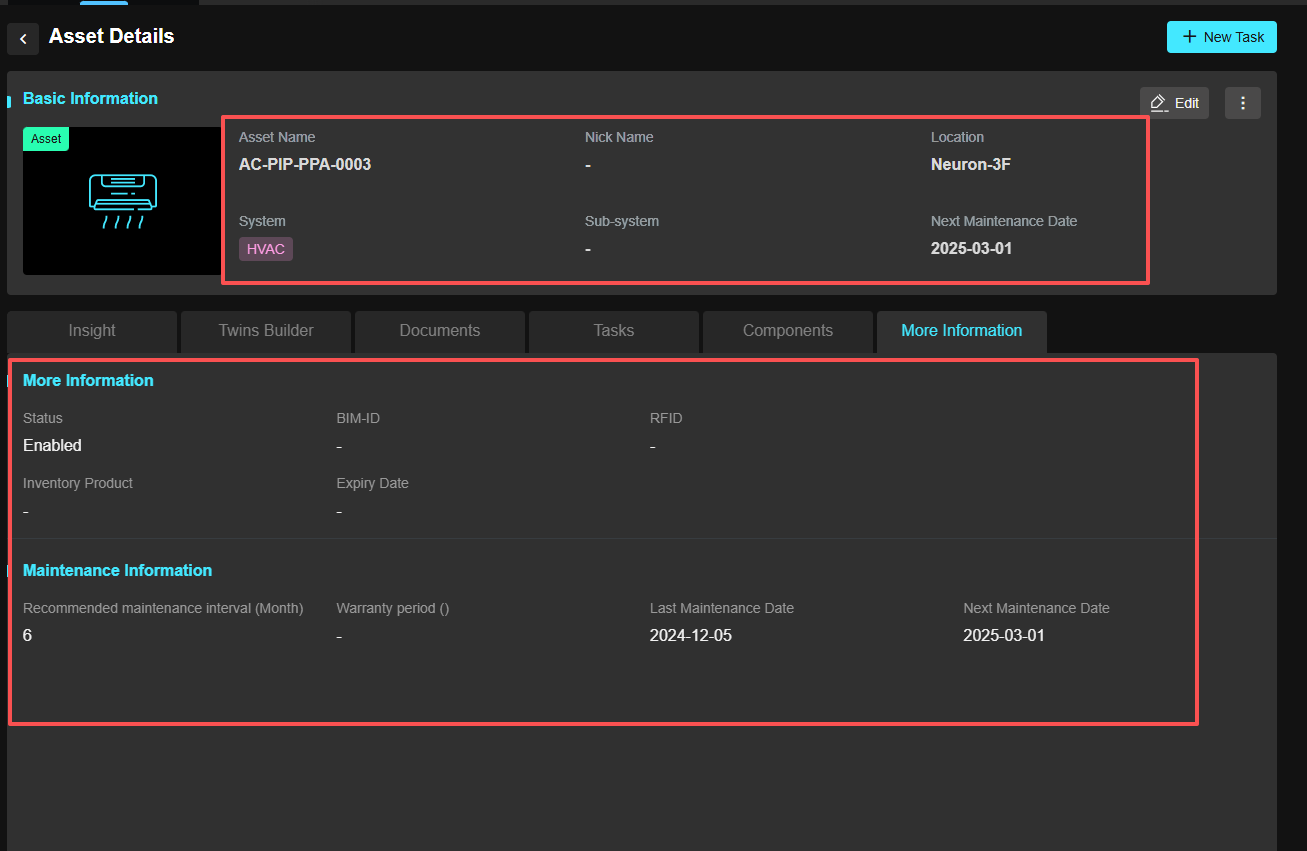
Phase 4: View and Maintain Device Information in the Asset Management Module
1. Automatic Device Synchronization
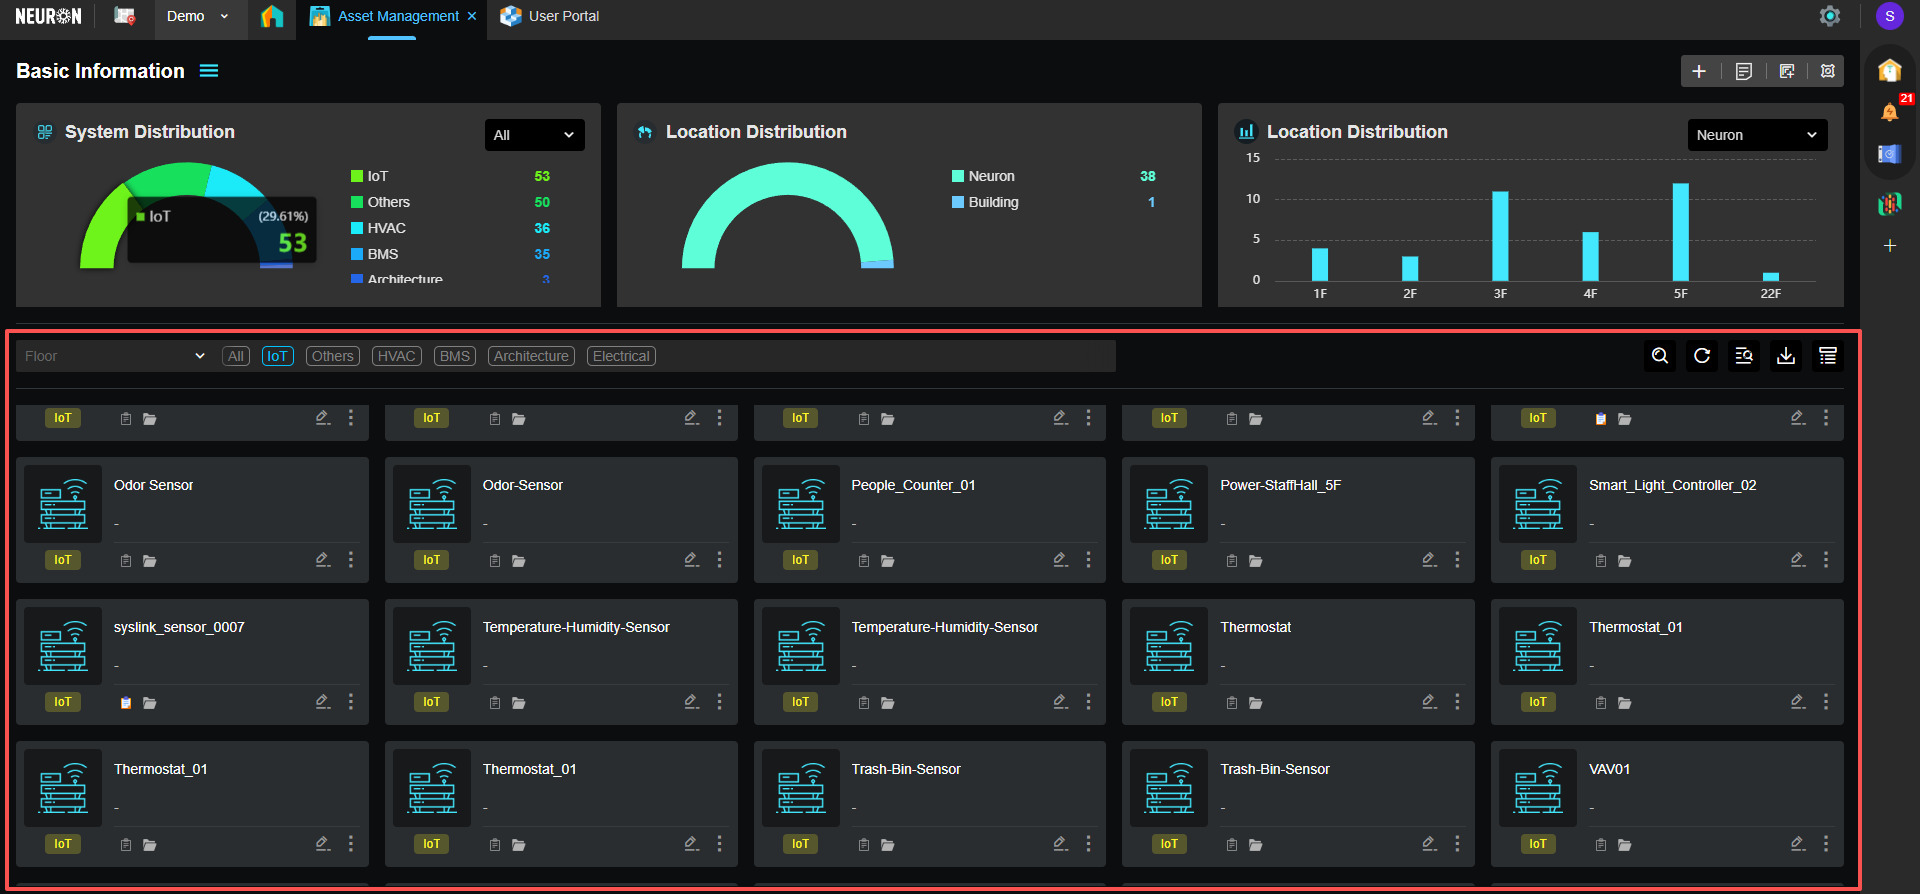
- Expected Outcome: After devices are integrated into the data platform, they are automatically synchronized to the Asset Management application.
2. Maintain Device Information
- Expected Outcome: Automatically see the integrated IAQ devices in "Asset Management > Device List", and be able to edit their location, system, maintenance information, and other detailed information.
Extension: Associate and View Device Data in Digital Twin Scenarios
1. Create a Model Scene and Configure Charts Linked to Device Data
- Expected Outcome: Enter the Twins Builder application. Create a model scene (e.g., "XX Building"), add charts and select the IAQ device data to display. Verify that the device's real-time data and alert status are displayed normally by viewing the detail charts.
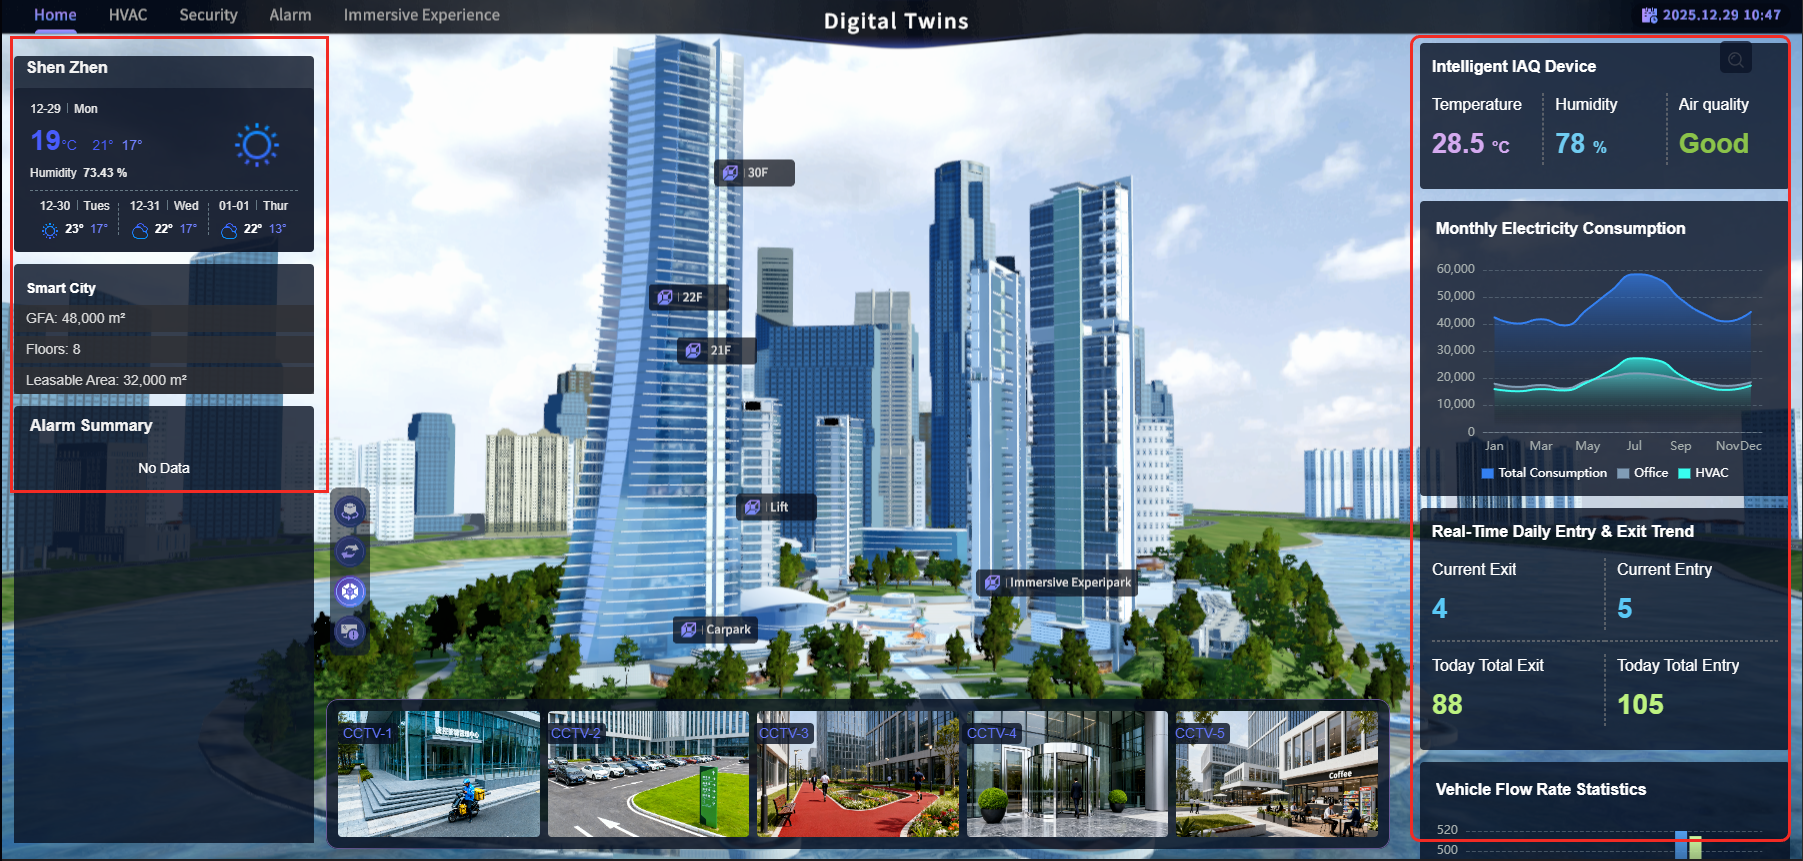
- Documentation Link:Create Scene / Configure Charts