Home Page
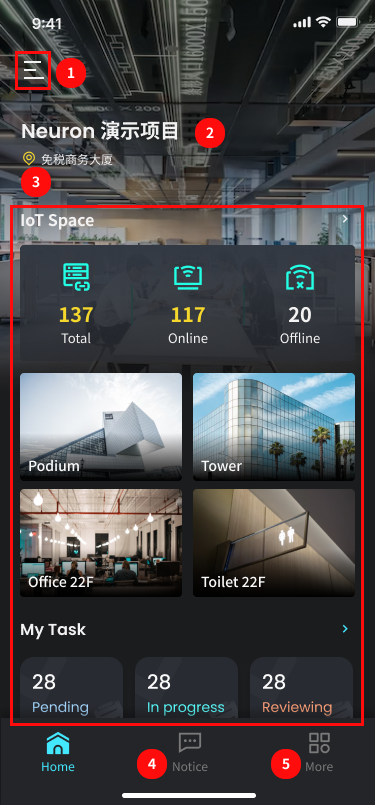
- Click to open the right-side menu bar.
- Displays the name of the current project. If the user is involved in multiple projects, they can click to switch between them.
- Displays KPIs related to the current project.
- Click “More” to open the application list, showing all applications that the user has access to within the current project (permissions are configured in the Neuron platform).
- Click to open the application list and view the applications within the project.
Right-Side Menu Bar
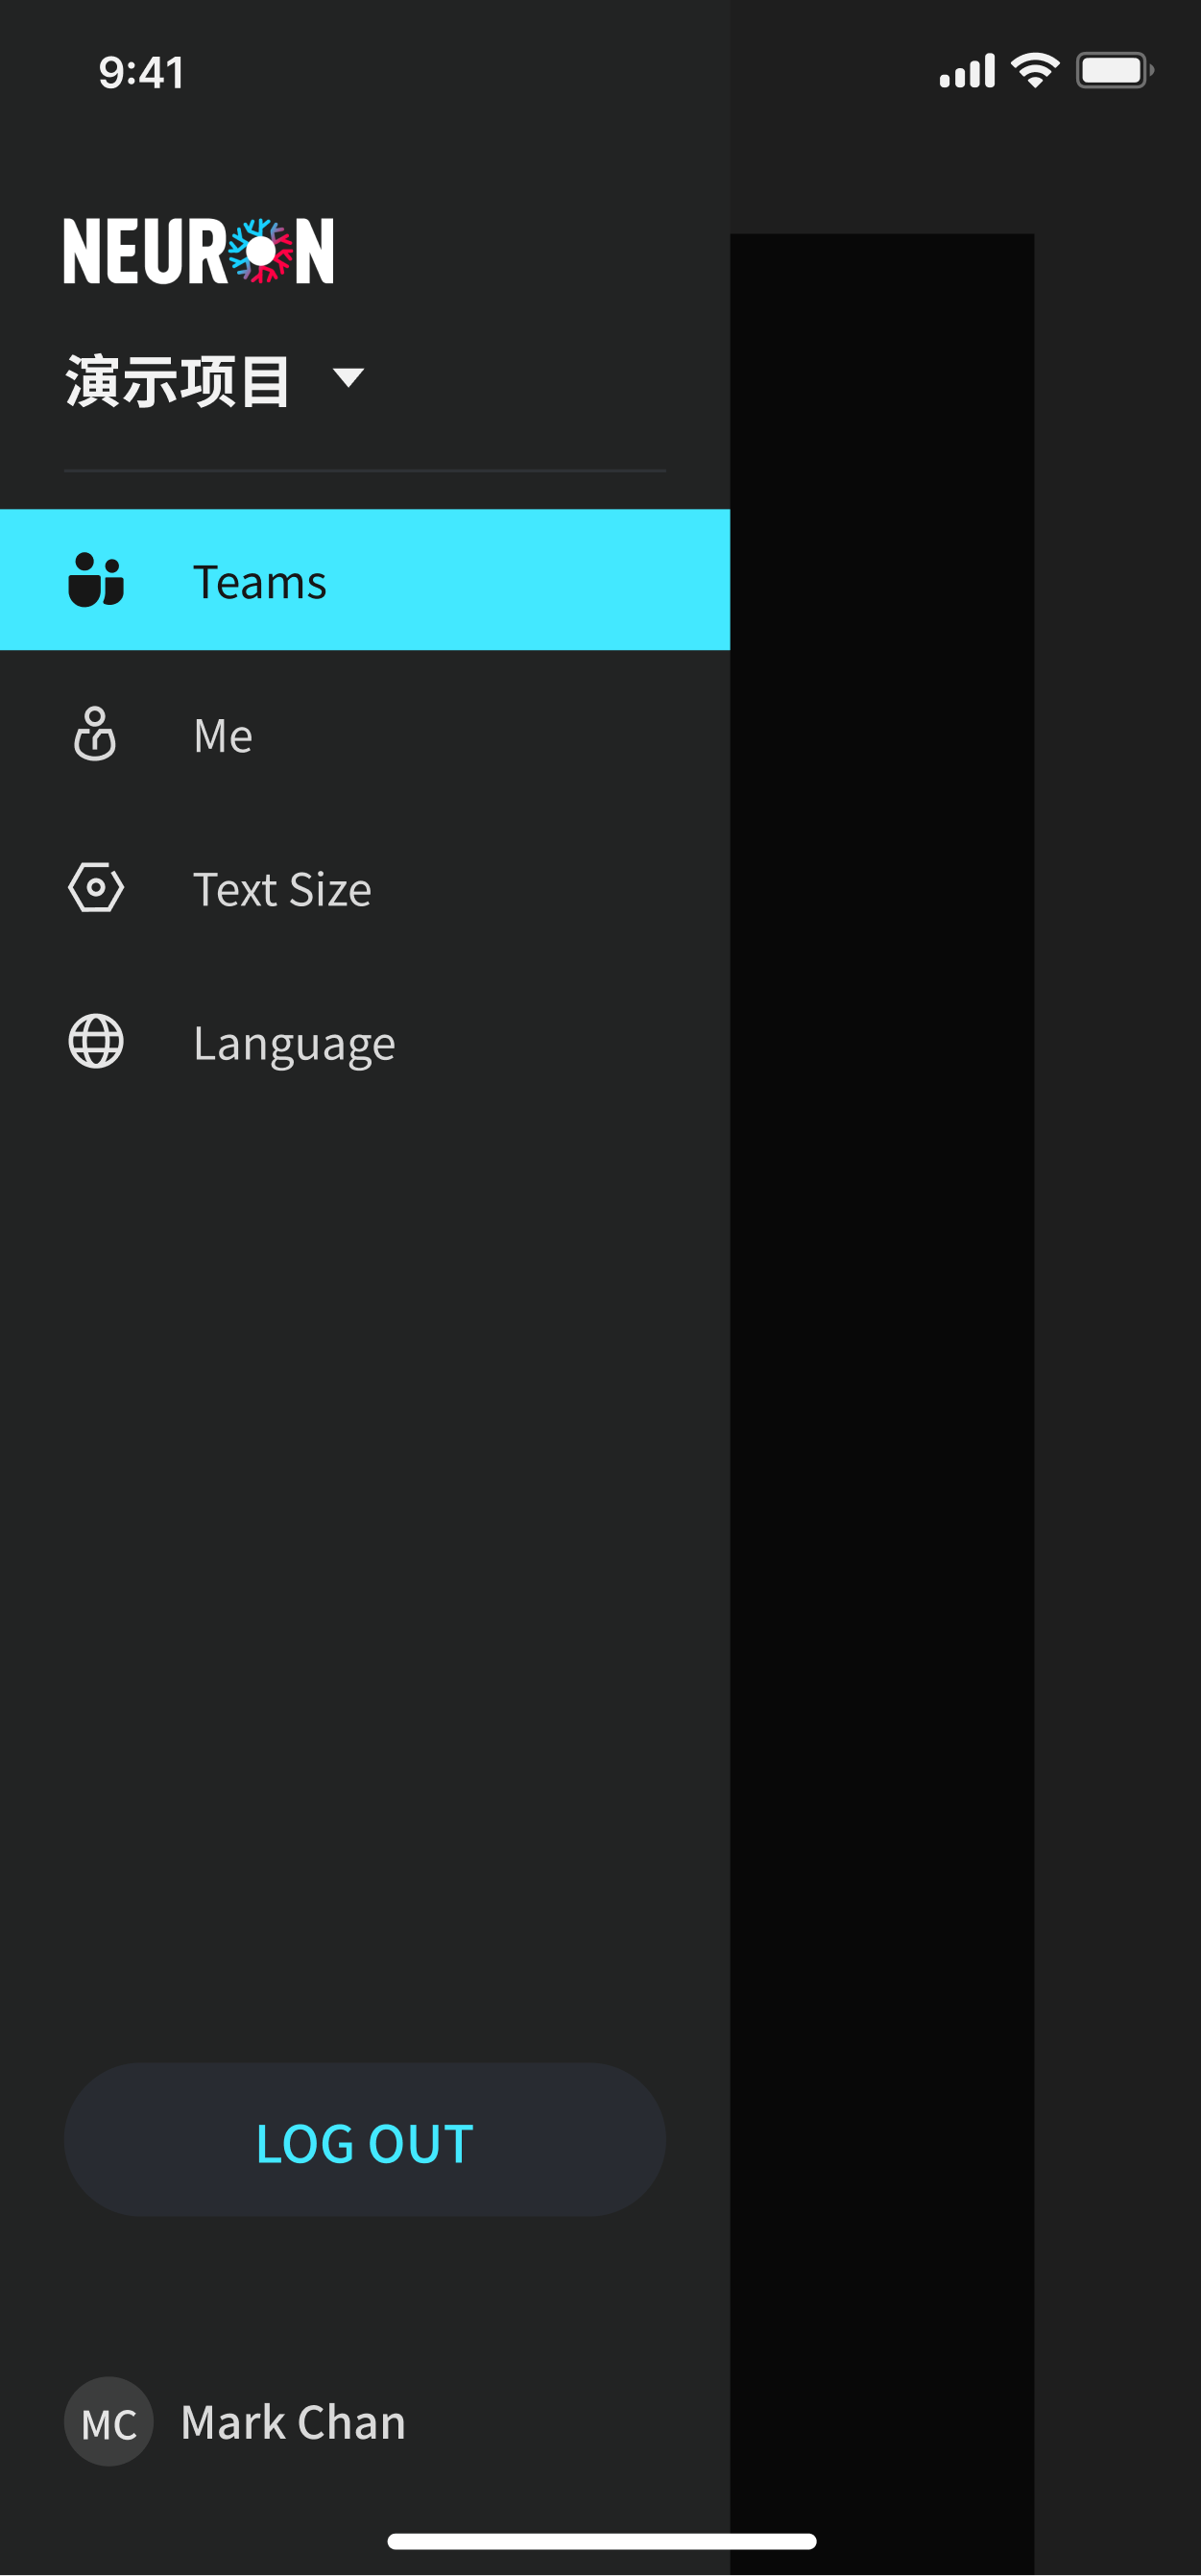
View team and personal information, adjust font size, and switch between languages.
Project Switching
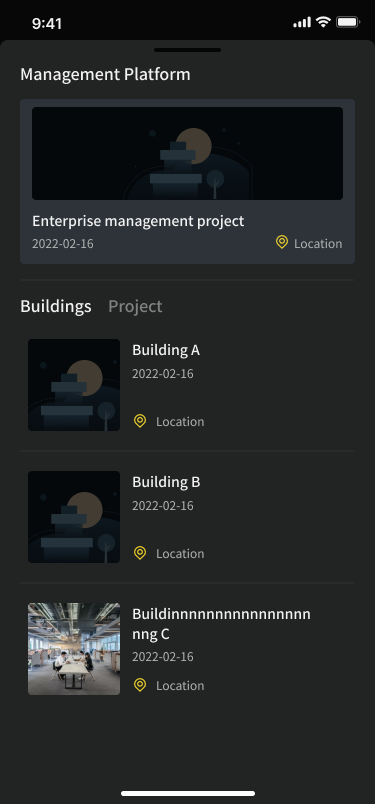
The project list data is synchronized with the Neuron platform, and the page is divided into three sections:
- Management Platform
- Buildings
- Projects
Application List
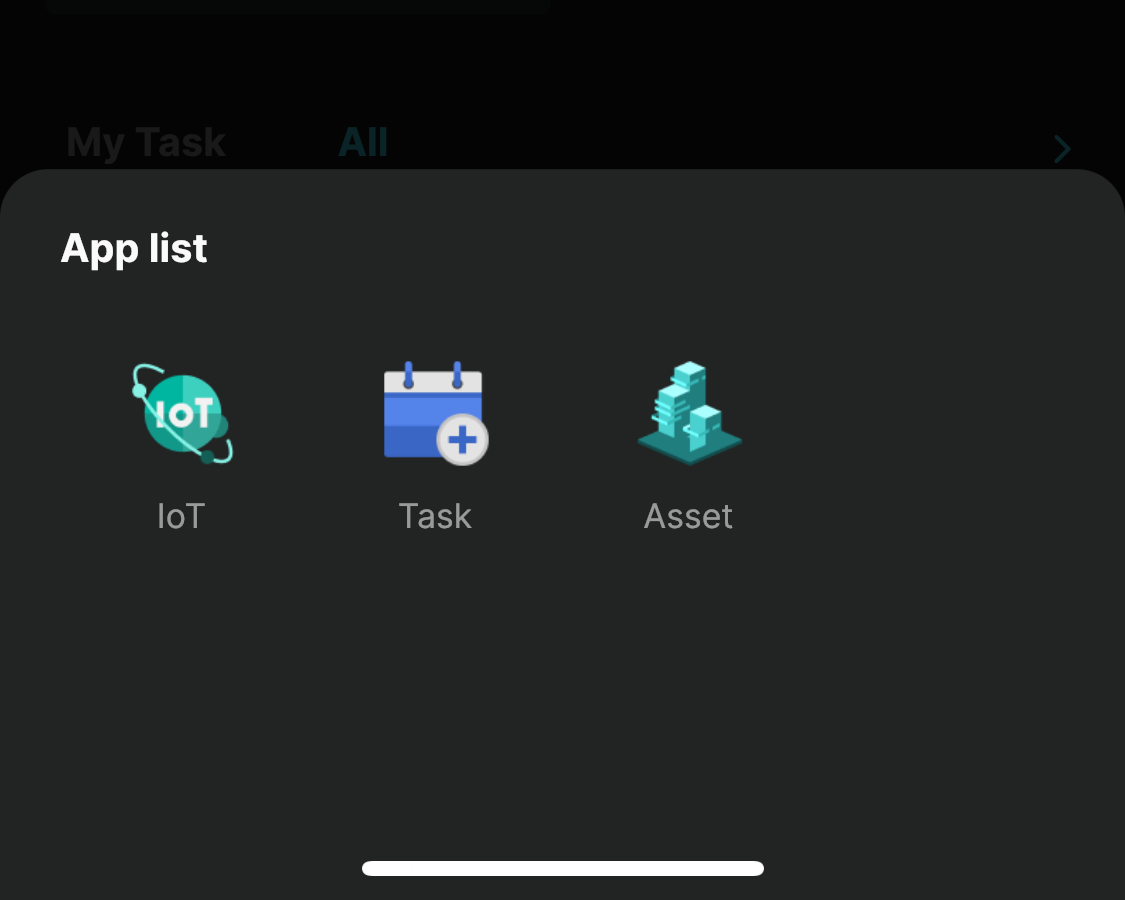
The data is synchronized with the Neuron platform and shows the application modules the current user has permission to view. Click the icon to enter the application.
Data Statistics
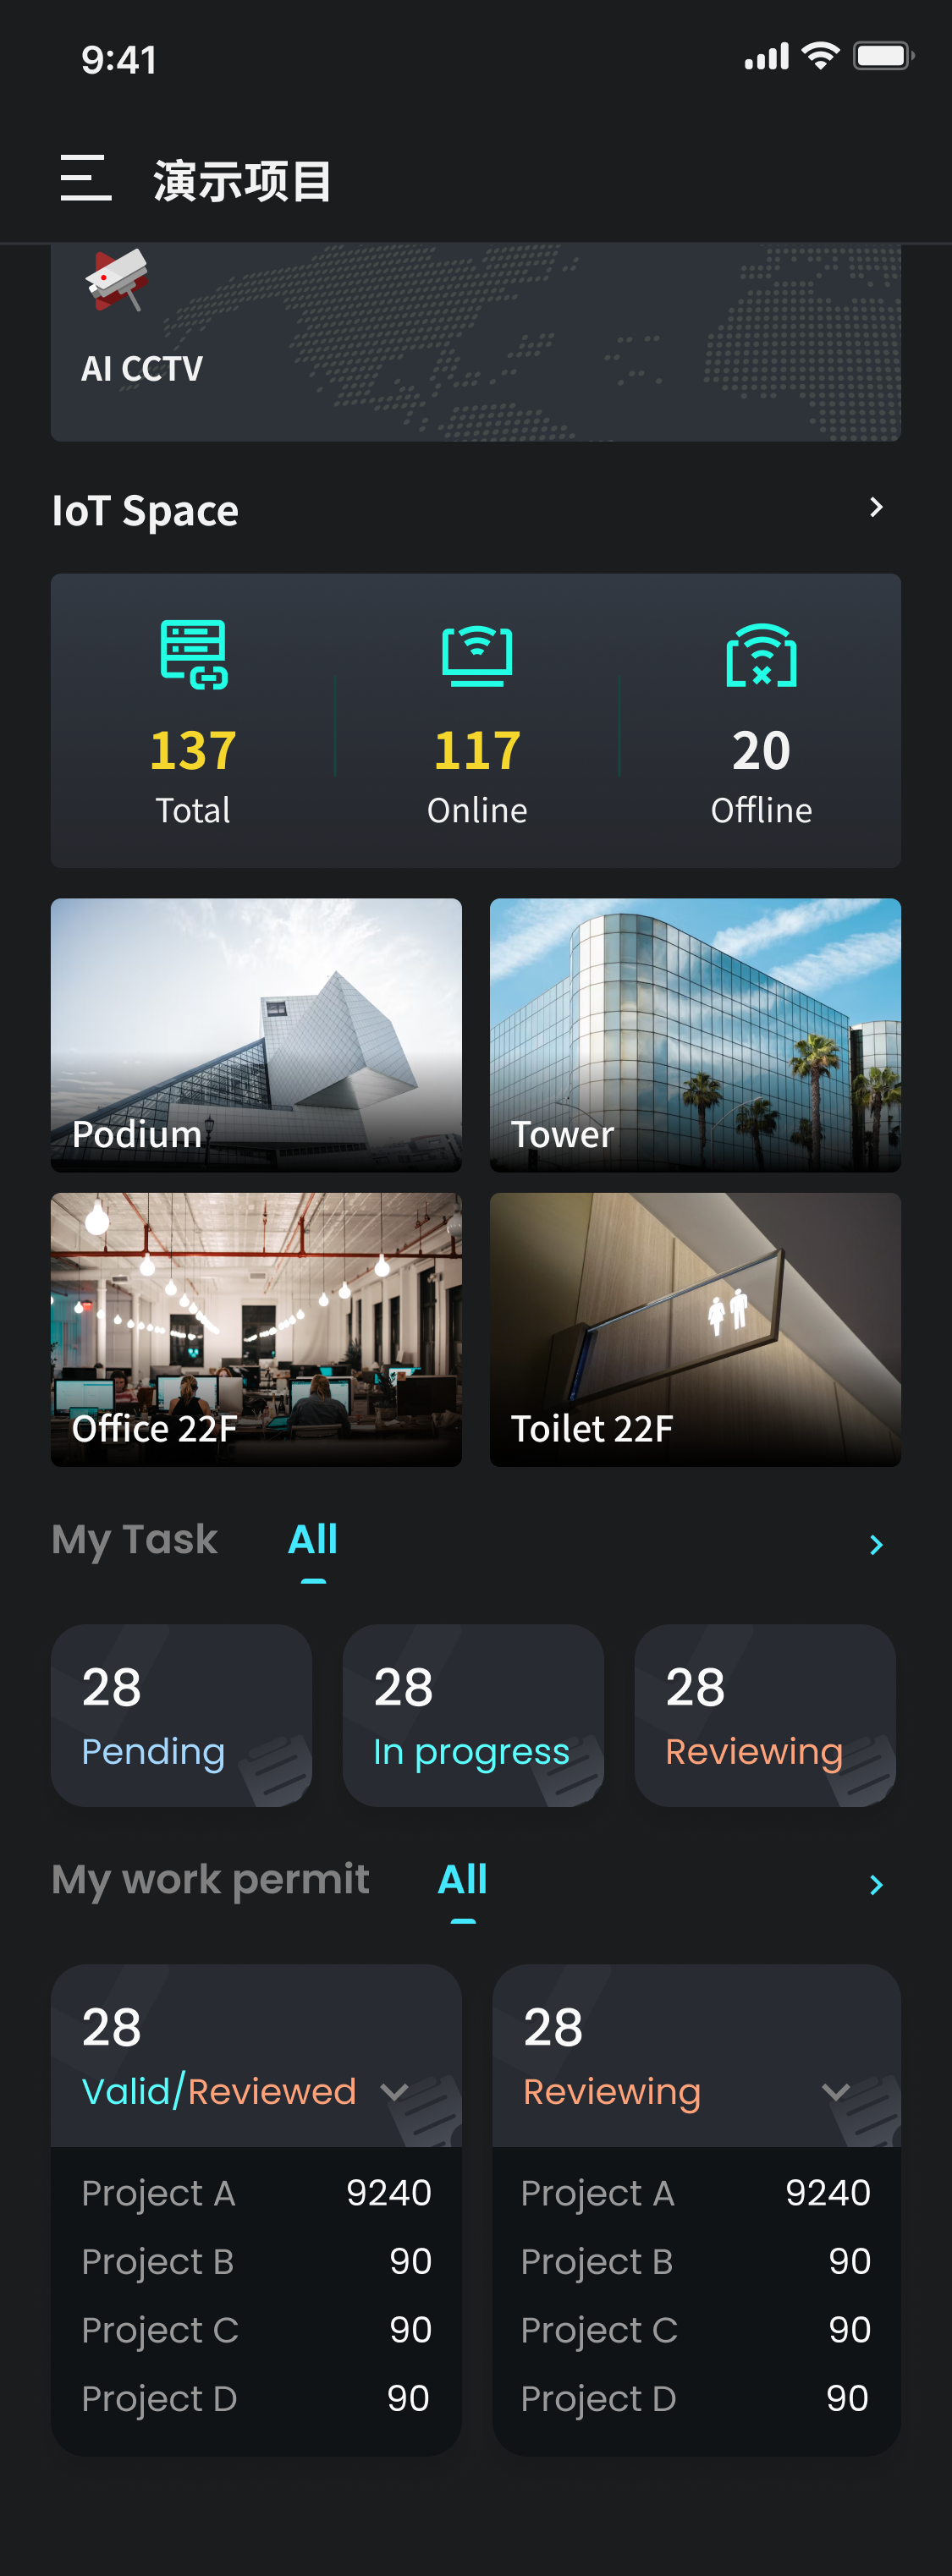
- IoT Device Status and Frequently Used Spaces: Shows the real-time status of IoT devices and frequently used spaces.
- Number of Work Orders (Classified by Status): Displays the number of work orders that require the user's attention, based on their permissions:
- Workers see work orders related to them.
- Administrators view all work orders within the project for efficient management.
- Permit-to-Work Management: Displays the status of work permit applications submitted by the user. Project administrators can view not only the current project but also the complete data of related sub-projects.