Home page
Overview
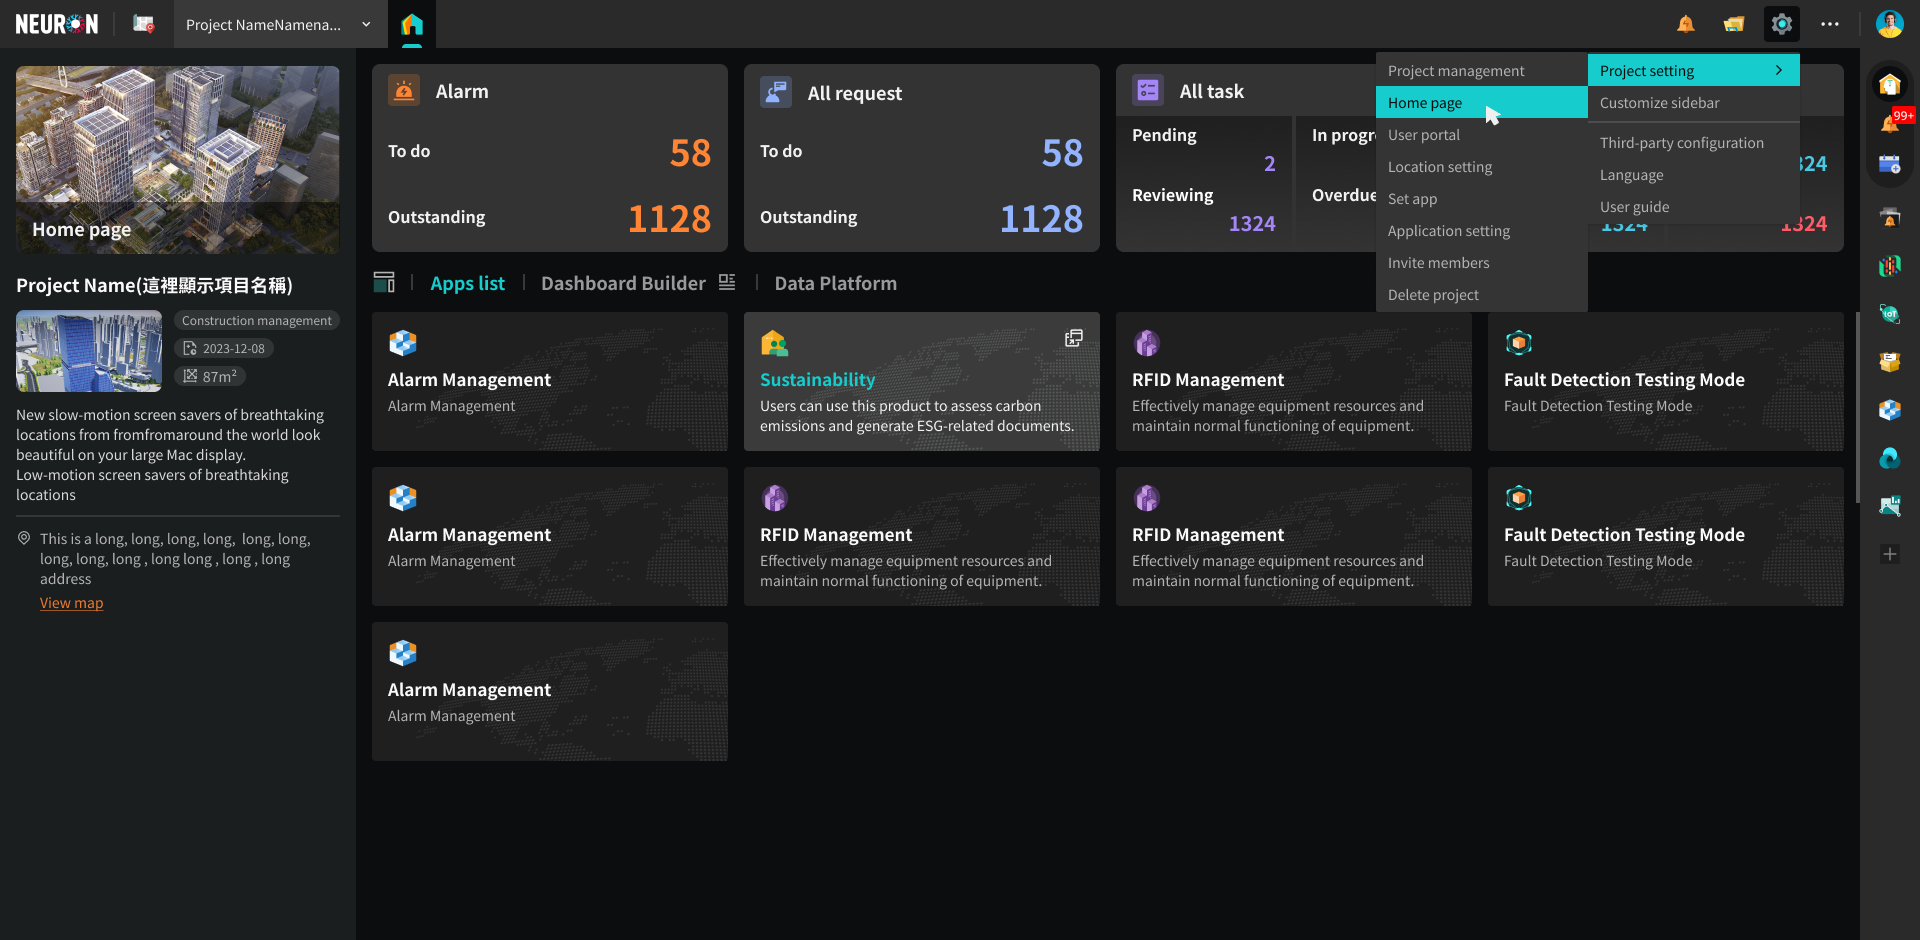
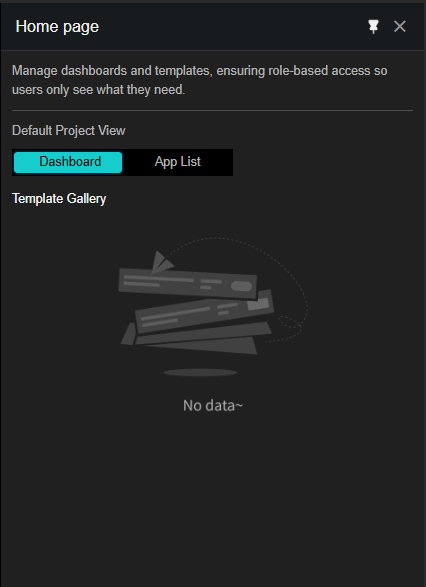
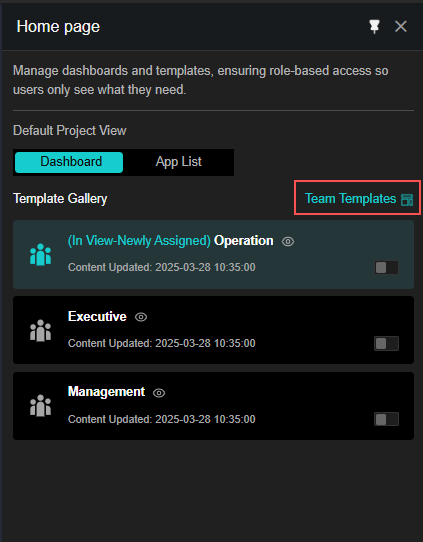
Primarily used for managing dashboards and templates, ensuring role-based access so that users only see the content they need.
Dashboard Introduction
Executive
This Dashboard is suitable for high-level decision-makers.
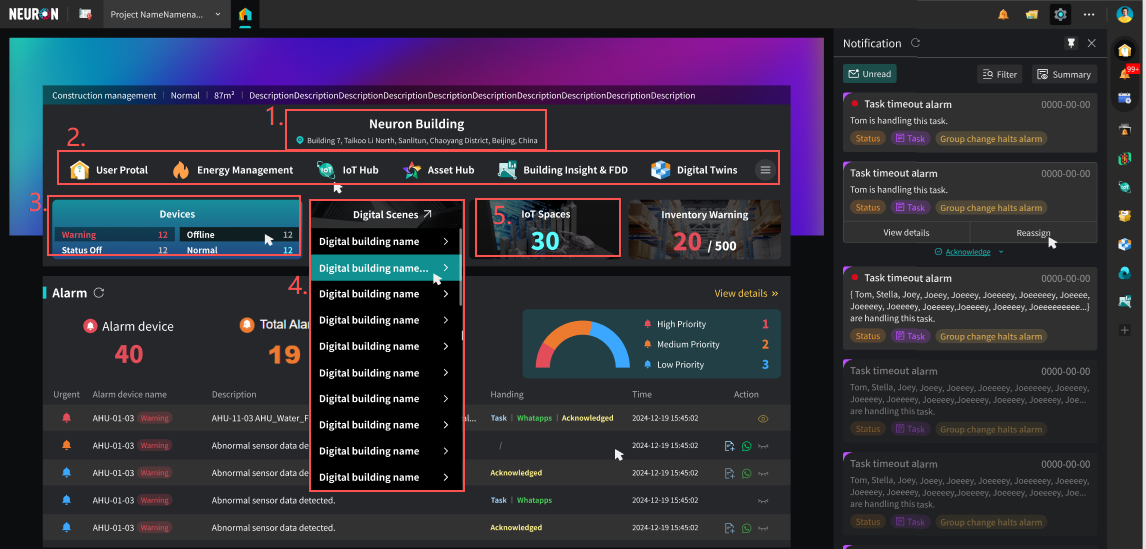
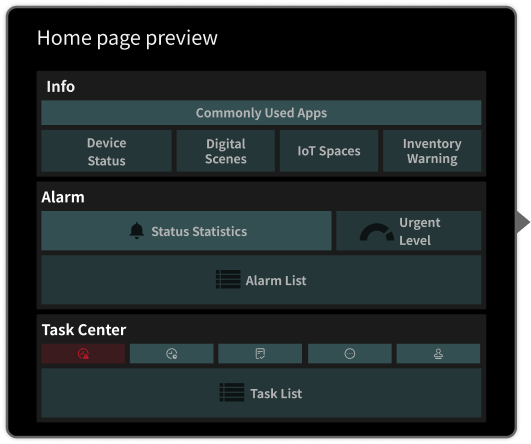
- Info: Mainly displays the project's basic information, application list, device status statistics, digital twin scenes, and other summary data.
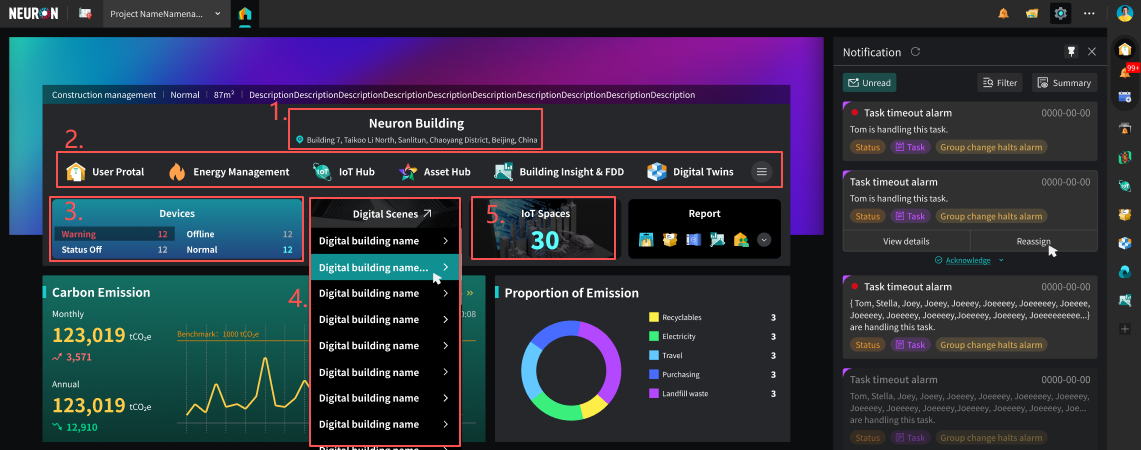
- Project Basic Information
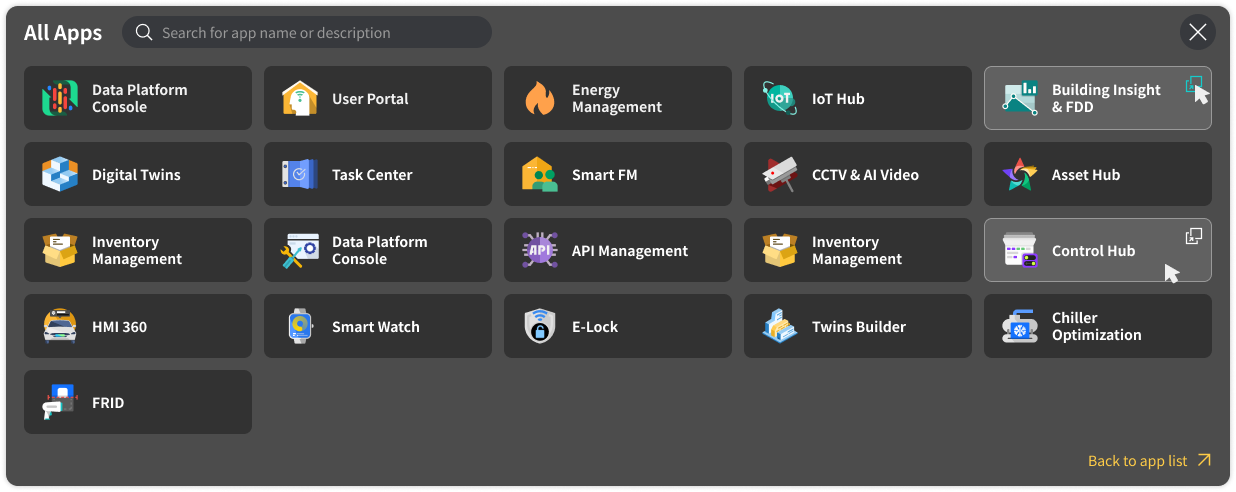
- Application List: Frequently used applications are pinned by default; click the icon on the far right to view more Apps.
- Device Status: Displays the real-time status of devices connected within the current project. Click to jump to "Building Insights & Fault Detection and Diagnosis" for details.
- Digital Scenes: Hover to reveal a menu showing the existing digital twin scenes within the project; click to directly view a specific scene.
- IoT: Hover to view existing Spaces; click to jump and view them. Note: The number of modules displayed here may vary depending on account permissions. Each user can only see applications they have permission to view. For specific permission configuration operations, please see Install Application and Configure Permissions.
-
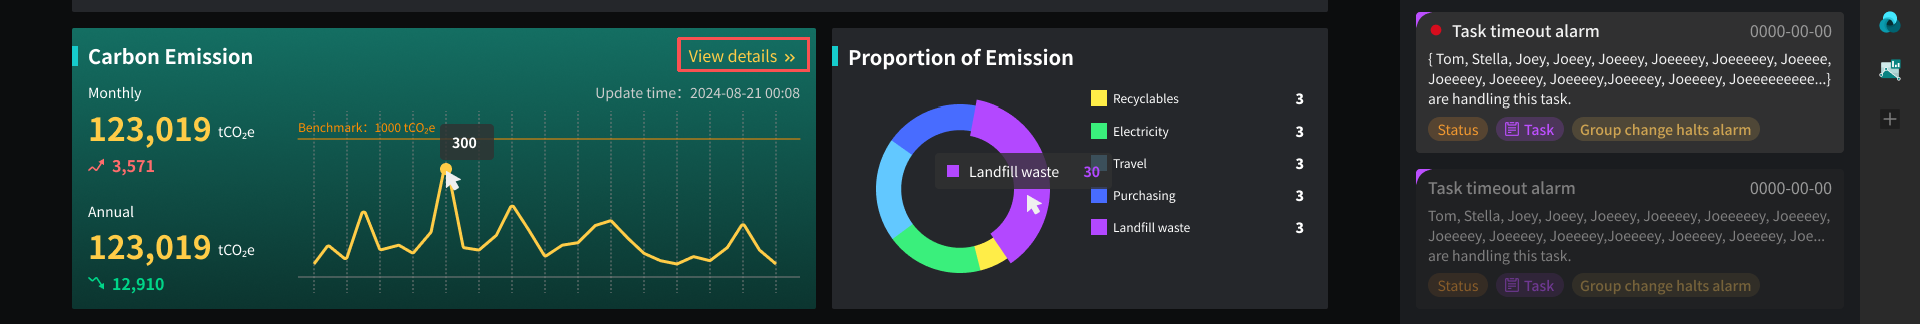
Carbon & Energy Management:Intuitively presents core carbon emission indicators and source composition for the project. Click "View Details" to delve into detailed data analysis.
-
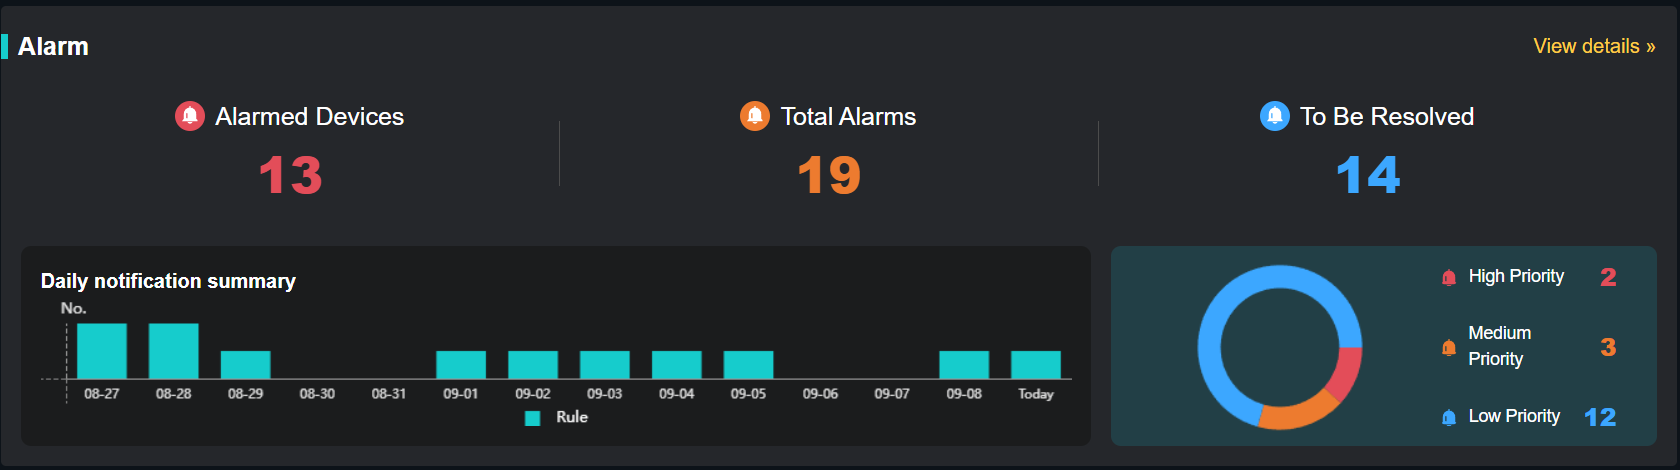
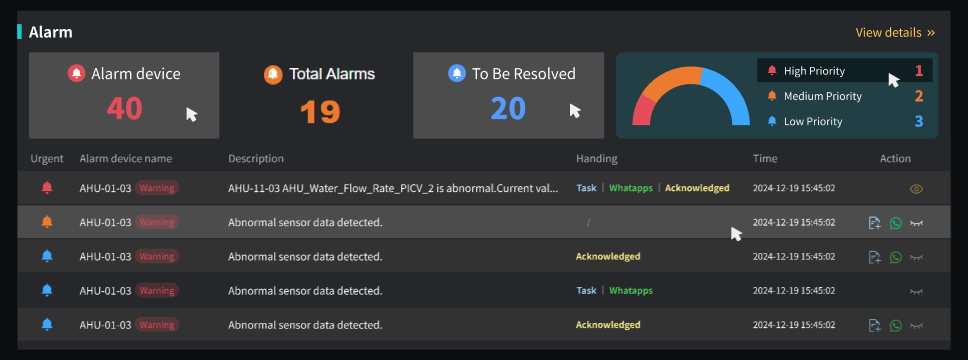
Alarm Statistics Panel:Centrally presents an overview of core alarm data, including the total number of alarming devices, total message count, and the number of high, medium, and low priority alarms, helping managers quickly grasp the overall alarm situation and assist in efficient decision-making.
-
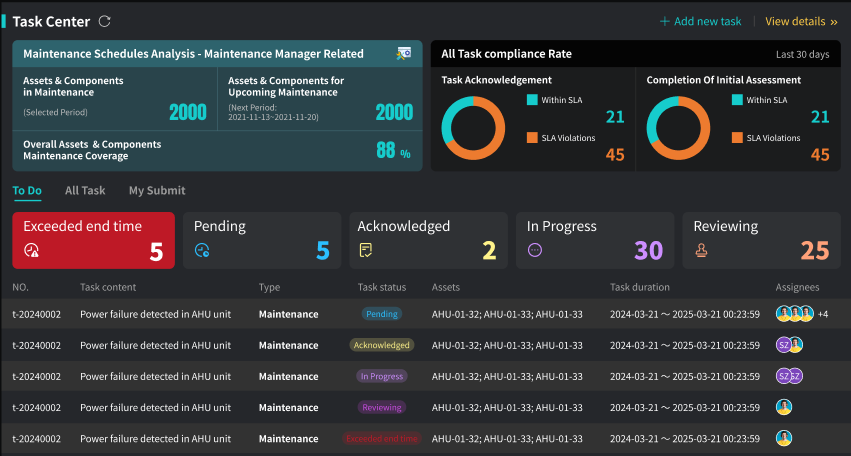
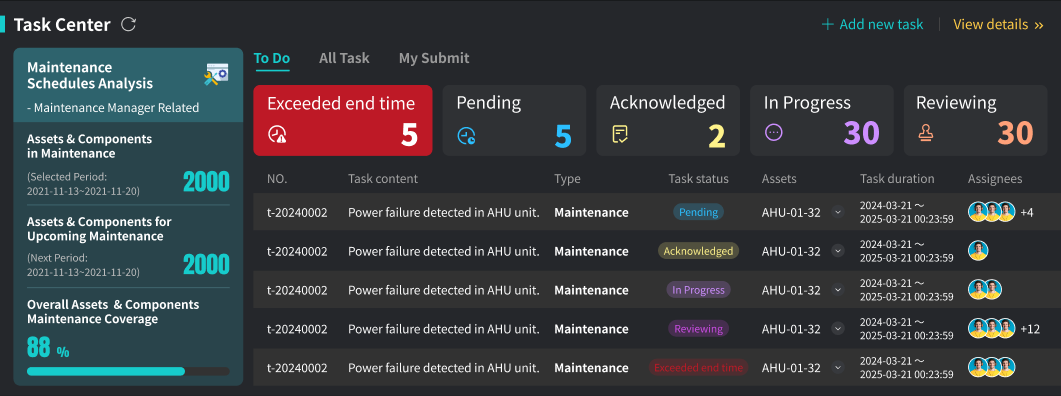
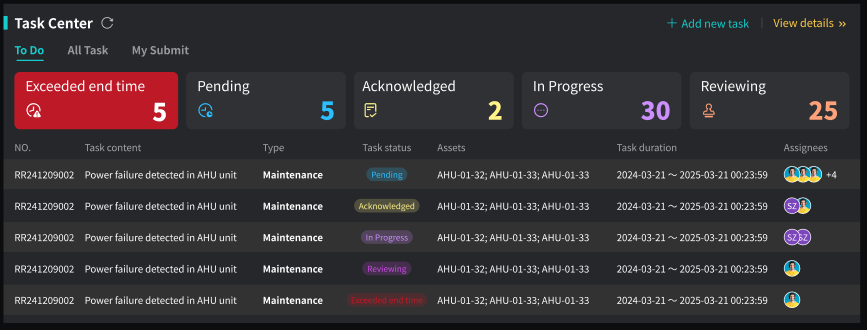
Task Center: Focuses on quality KPIs such as task compliance analysis and completion rate. Provides a task list that can be filtered by status and quickly processed, and displays recently maintained devices and maintenance coverage, achieving closed-loop management from quality assessment to task execution.
-
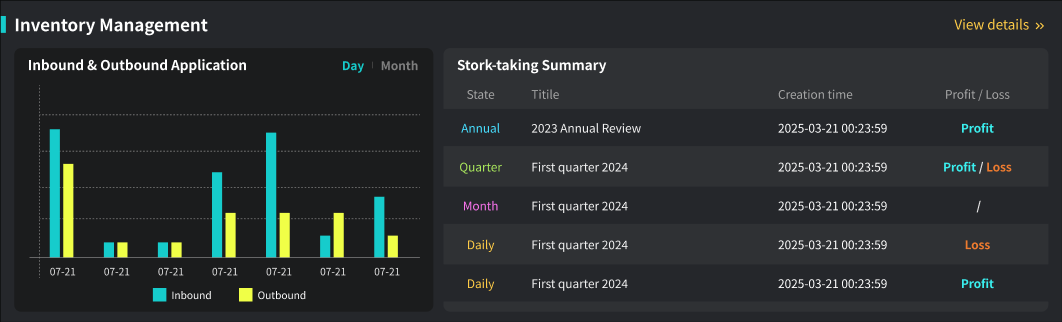
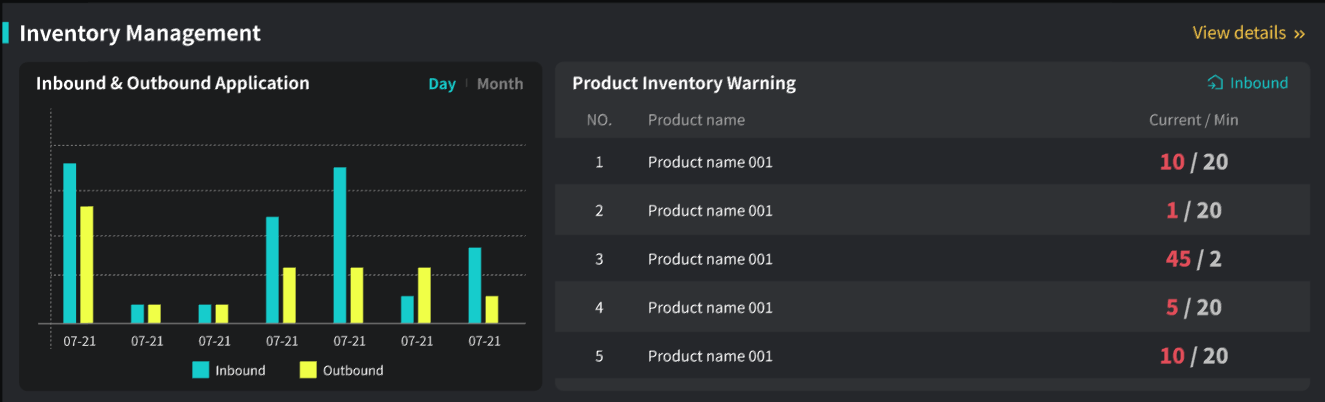
Inventory Management: Centrally presents inventory in/out application records and periodic inventory summary results. Supports viewing by day/month dimensions, helping managers quickly grasp inventory flow and profit/loss status, assisting in inventory decision-making.
Management
This Dashboard is suitable for property administrators.
- Info: Mainly displays project basic information, application list, device status statistics, digital twin scenes, and other aggregated data.
- Project Basic Information
- Application List: Frequently used applications are pinned by default; click the icon on the far right to view more Apps.
- Device Status: Displays the real-time status of devices connected within the current project. Click to jump to "Building Insights & Fault Detection and Diagnosis" for details.
- Digital Scenes: Hover to reveal a menu showing the existing digital twin scenes within the project; click to directly view a specific scene.
- IoT: Hover to view existing Spaces; click to jump and view them. Note: The number of modules displayed here may vary depending on account permissions. Each user can only see applications they have permission to view. For specific permission configuration operations, please see 【Install Application and Configure Permissions】.
-
Alarm Statistics Panel: Providing a centralized overview of critical alarm data, this feature empowers managers to rapidly assess the comprehensive alarm landscape and make informed decisions efficiently. Additionally, an alarm list with integrated action buttons allows for seamless and quick handling of alarm workflows directly from the homepage, including functionalities like task submission, alarm acknowledgment, inspection result submission, and direct navigation to 3D views.
-
Task Center: Provides a list of recently maintained devices and an overview of maintenance coverage. Supports filtering and processing task lists by status, assisting property personnel in efficiently executing and tracking daily maintenance work.
-
Inventory Management: Centrally presents inventory in/out application records and periodic inventory summary results. Supports viewing by day/month dimensions, helping managers quickly grasp inventory flow and profit/loss status, assisting in inventory decision-making.
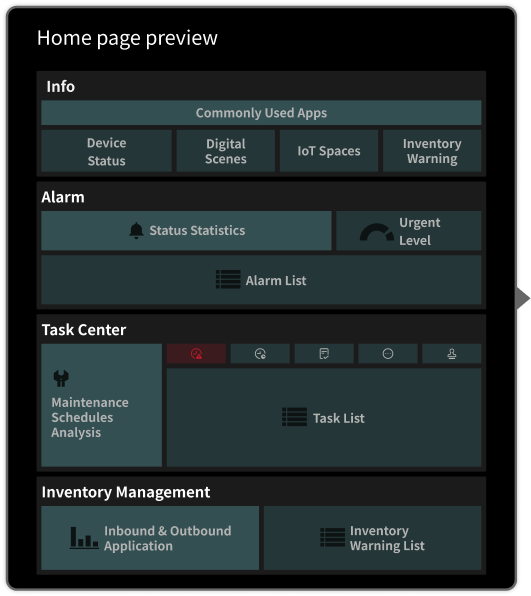
Operation
This Dashboard is suitable for frontline staff and executors.
- Info: Mainly displays project basic information, application list, device status statistics, digital twin scenes, and other aggregated data.
- Project basic information
- Application list: Commonly used applications are fixed by default; click the icon on the far right to view more Apps
- Device status: Displays the real-time status of connected devices in the current project. Click to jump to "Building Insight & Fault Detection & Diagnosis" for details
- Digital scenes: Hover to display a menu showing existing digital twin scenes in the project; click to directly jump to view specific scenes
- IoT: Hover to view existing Spaces; click to jump to view Note: The number of modules displayed here may vary depending on account permissions. Each user can only see applications they have permission to view. For specific permission configuration operations, please see Install Application and Configure Permissions.
- Alarm Statistics Panel: Mainly displays detailed alarm information lists, including specific information such as alarm device, alarm type, occurrence time, and priority. Supports frontline staff directly operating alarms on this panel, such as acknowledging alarms, marking as in progress, resolving alarms, etc.
- Task Center: Provides a task list that can be filtered and processed by status, supporting workers to quickly receive, process, and update the status of daily maintenance work orders.
Dashboard Assignment
Dashboard assignment must be performed by an administrator.
When a user enters a project for the first time (i.e., has not been assigned a Dashboard), the home page displays the App List by default.
-
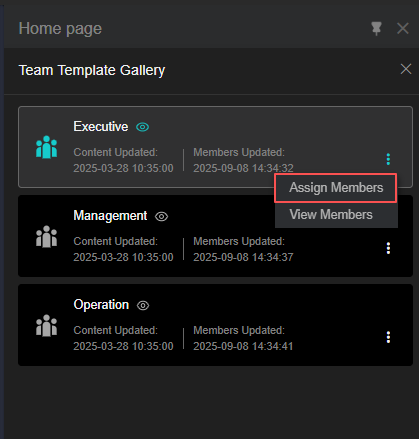
As an administrator, assign Dashboards to users via Team Templates -> Assign Members.
-
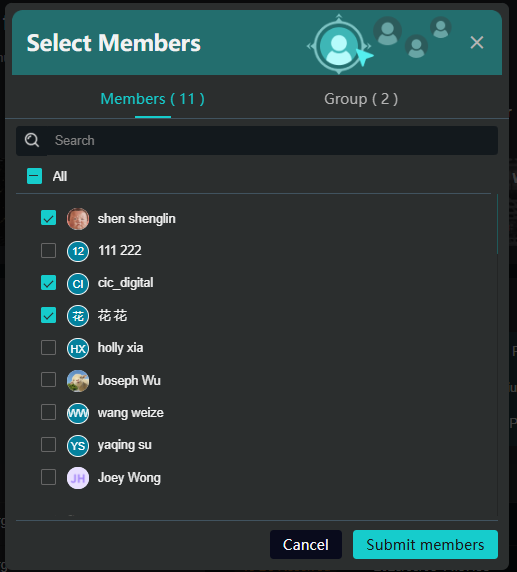
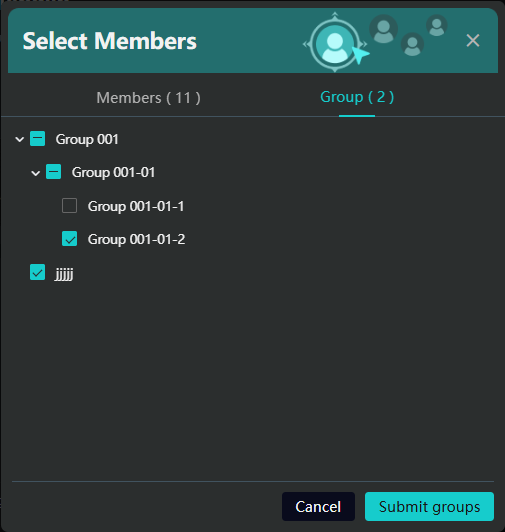
Administrators can add individual or multiple users via Member; they can also add an entire Group.
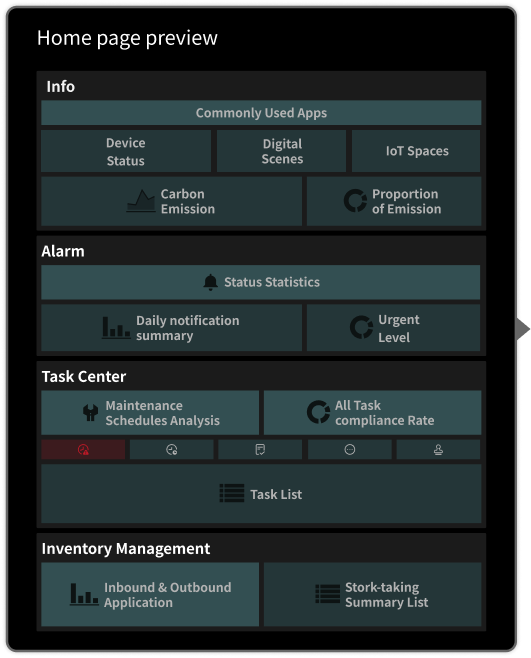
Default Dashboard Configuration
- When a user is assigned multiple Dashboards, the system displays the most recently added Dashboard by default.
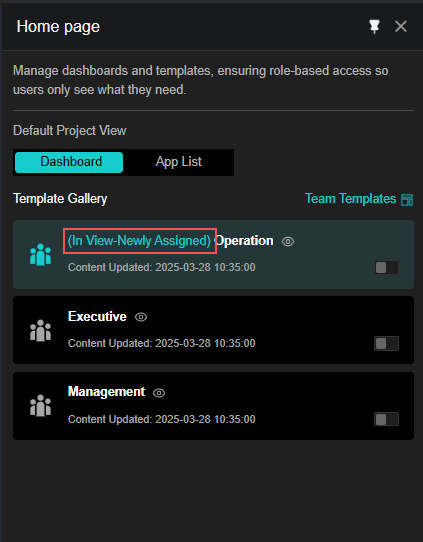
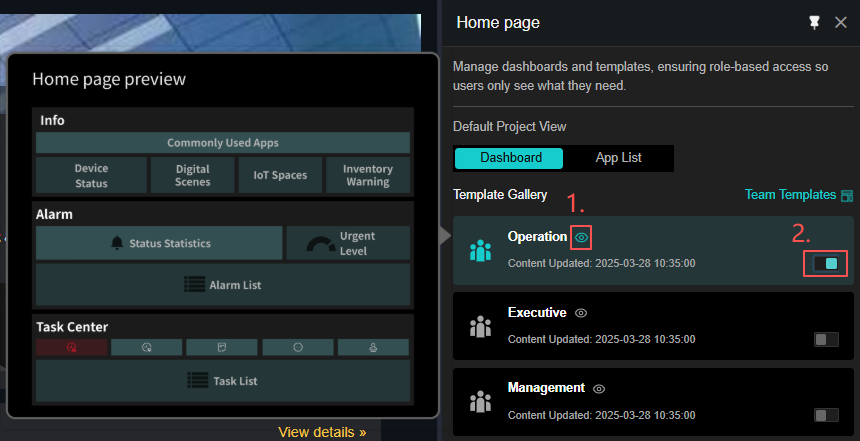
- Users can hover the mouse over the eye icon to preview a Dashboard.
- Users can manually apply a Dashboard by toggling the switch on.