Dashboard Introduction
Overview
The Energy and Carbon Management Dashboard serves as your project's energy and carbon emissions data center. Once all settings are complete, the system automatically generates an overview dashboard that visually presents the project's overall energy and carbon status.
Dashboard Page
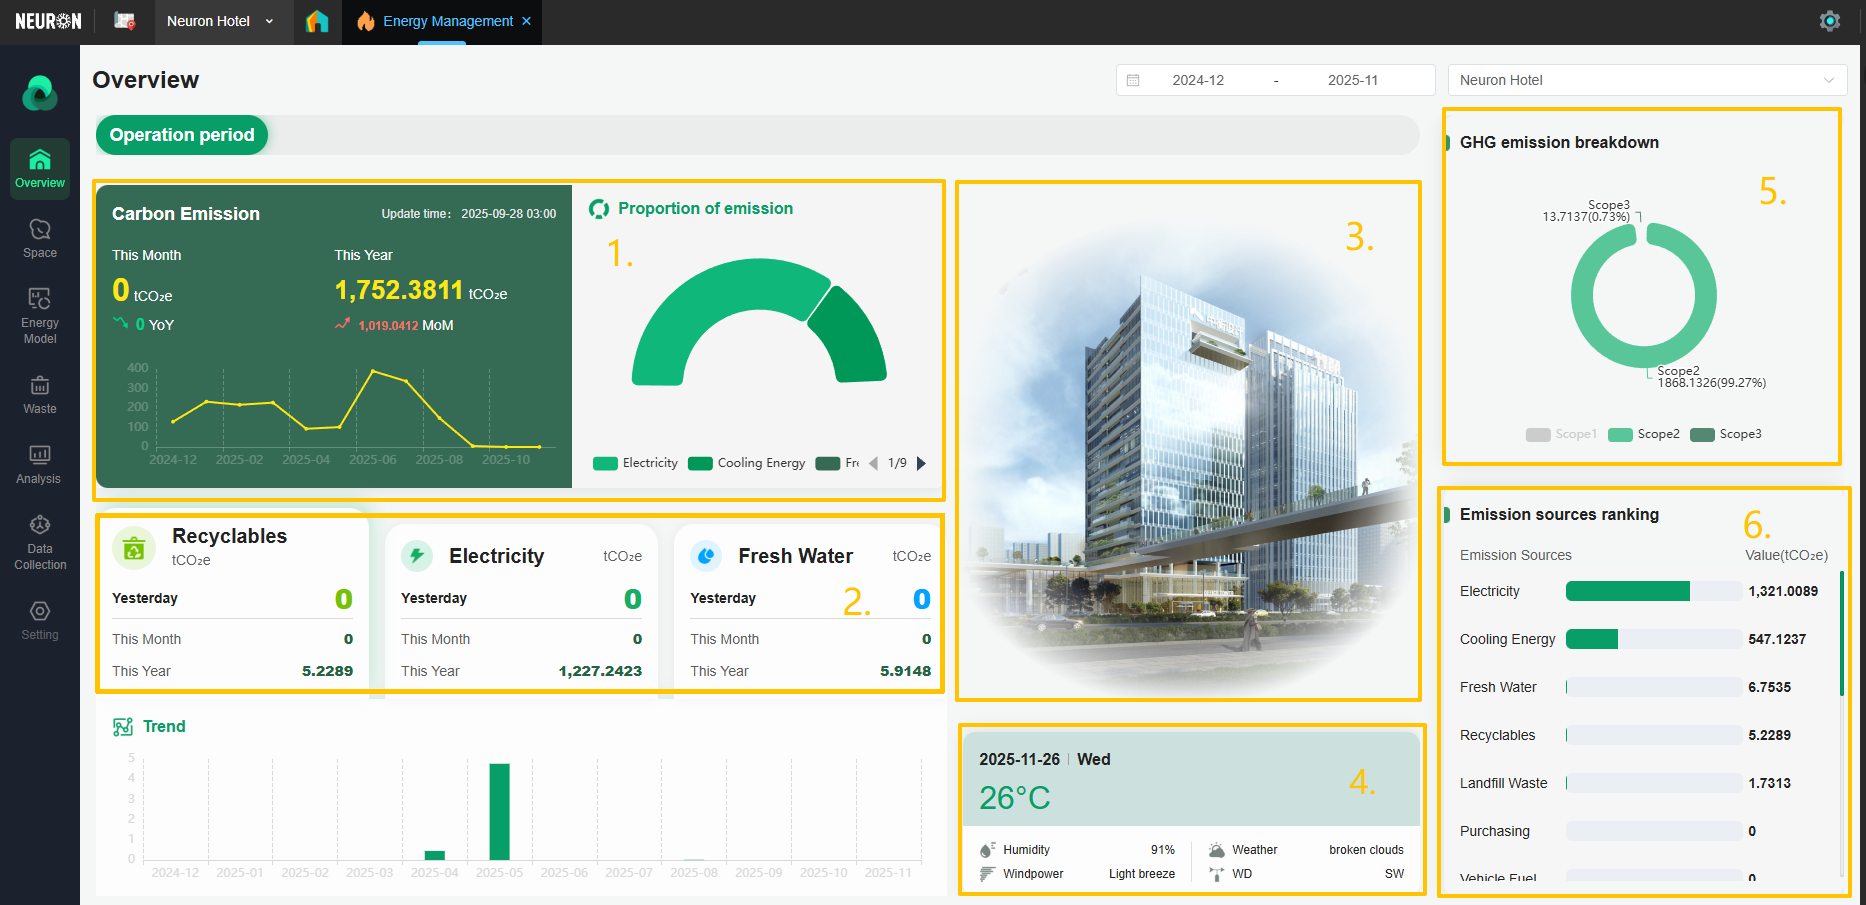
Upon entering the homepage of the energy and carbon management module, you will typically see a dashboard that provides an overall overview. After completing the first five setup steps, you will receive a summary of data that directly reflects the current project's data closely related to energy, waste, and carbon emissions.

- Displays the total carbon emission data and trends for the current project (including data for the current month with a year-over-year (YoY) comparison for the month, and data for the current year with a month-over-month (MoM) comparison for the year), including the proportion of data from different emission sources.
- Shows the carbon emission status and trends for core utilities: electricity, water, and gas respectively.
- Displays an image of the current project. If you want to change this image, you can go to "Project Setting" in the platform, find "project management", and replace the corresponding image.

- Shows the real-time temperature at the project location for the current day. Like the image, the specific location can also be viewed and modified in "project management".
- Displays the data and proportion of carbon emissions for Scope 1, 2, and 3 respectively.
- Shows the ranking of different emission sources.