Analysis & Reporting
Overview
This module serves as the data decision center for energy and carbon management. It transforms the collected raw data into multi-layered, interactive insights and supports the generation of structured reports. It can systematically manage the entire process from data monitoring and problem analysis to results reporting.
Energy Consumption Model
The Energy Consumption Model is used to analyze the current energy consumption situation within the system.
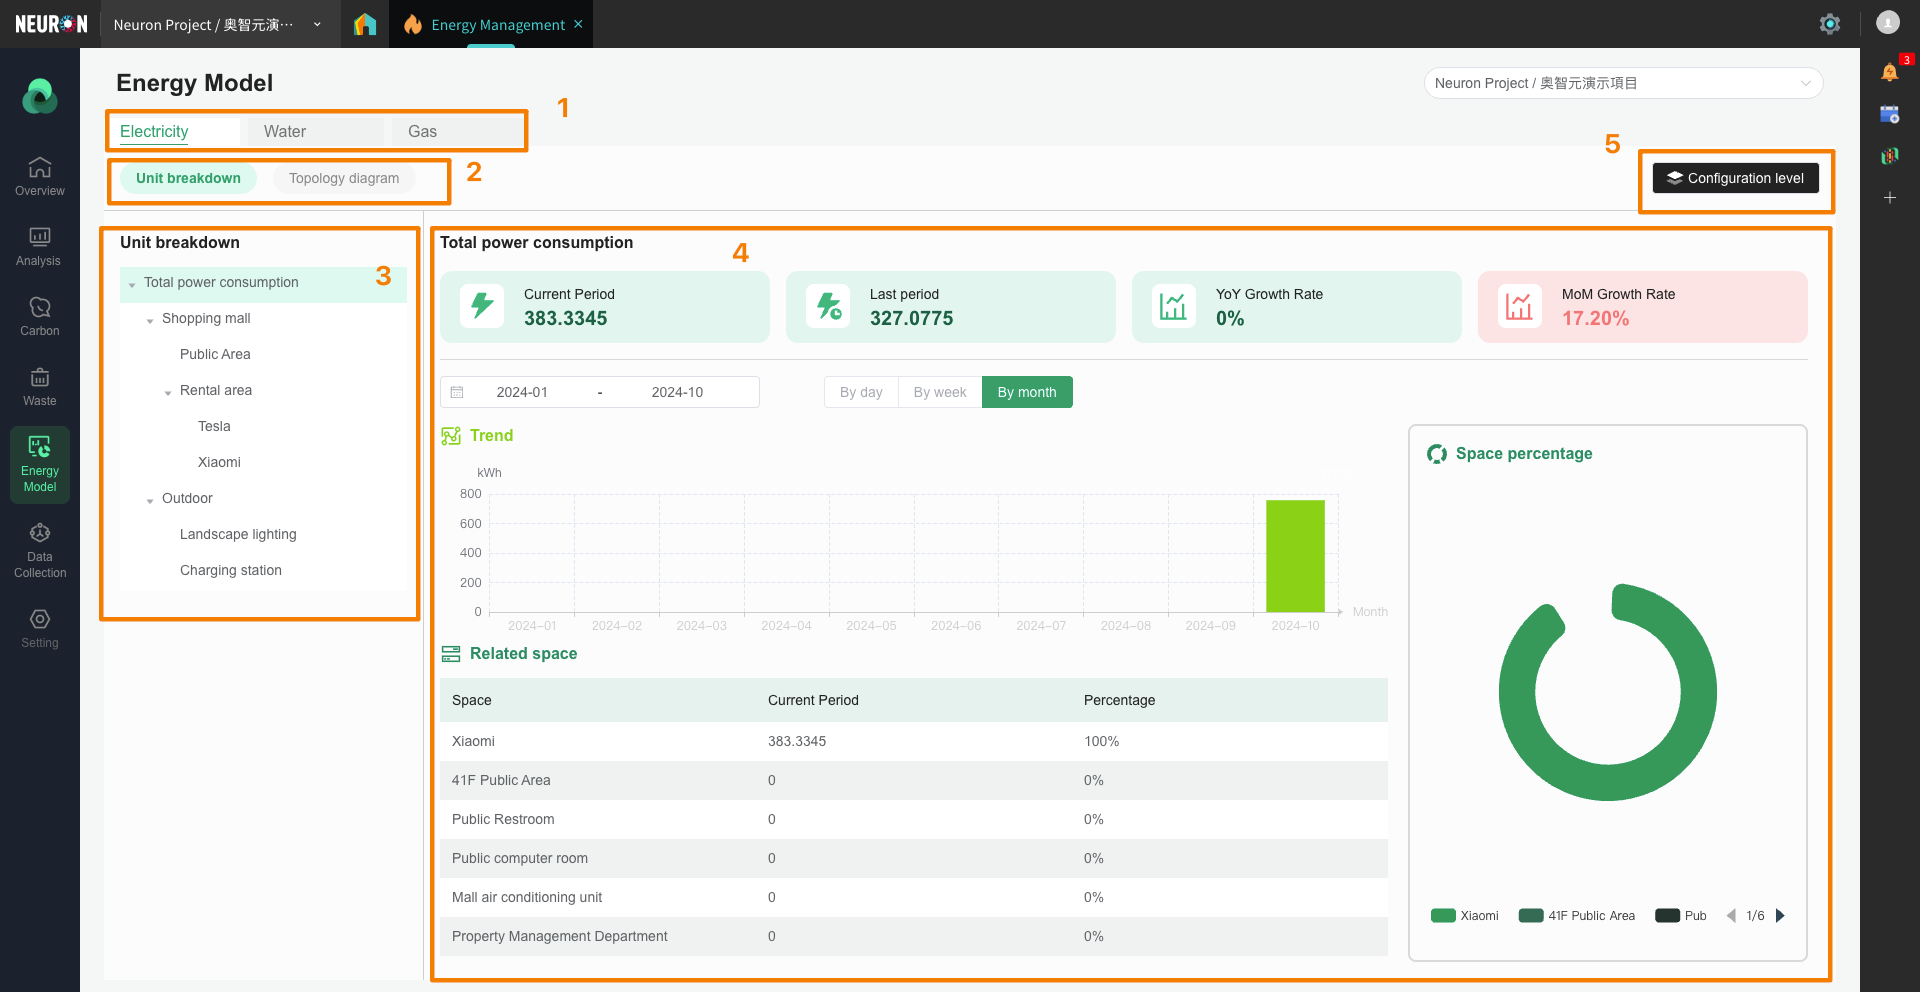
- The energy consumption model is divided into three types: Electricity, Water, and Gas, displaying data for different types of devices respectively.
- The energy consumption model has two display forms: Item Details and Topology Diagram.
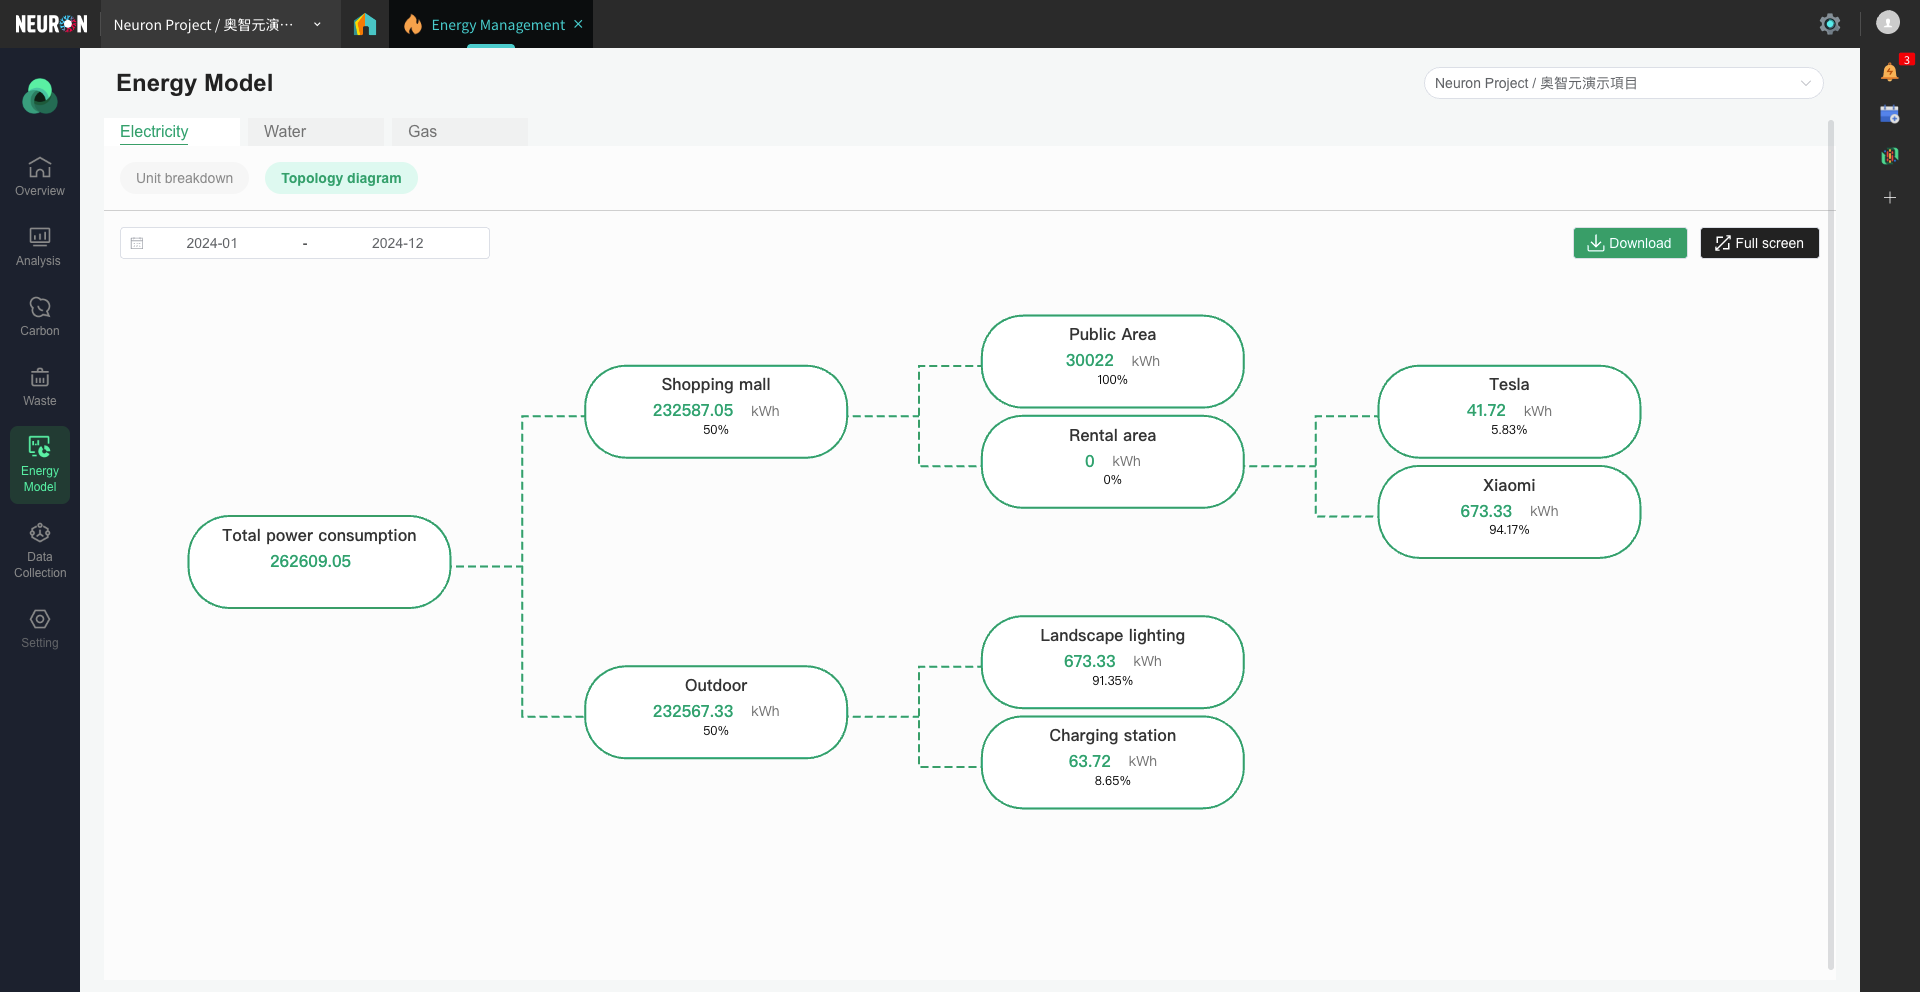
- Item Details is a tree structure that users can customize.

- The data summary of the selected level is displayed in the right-hand dashboard.
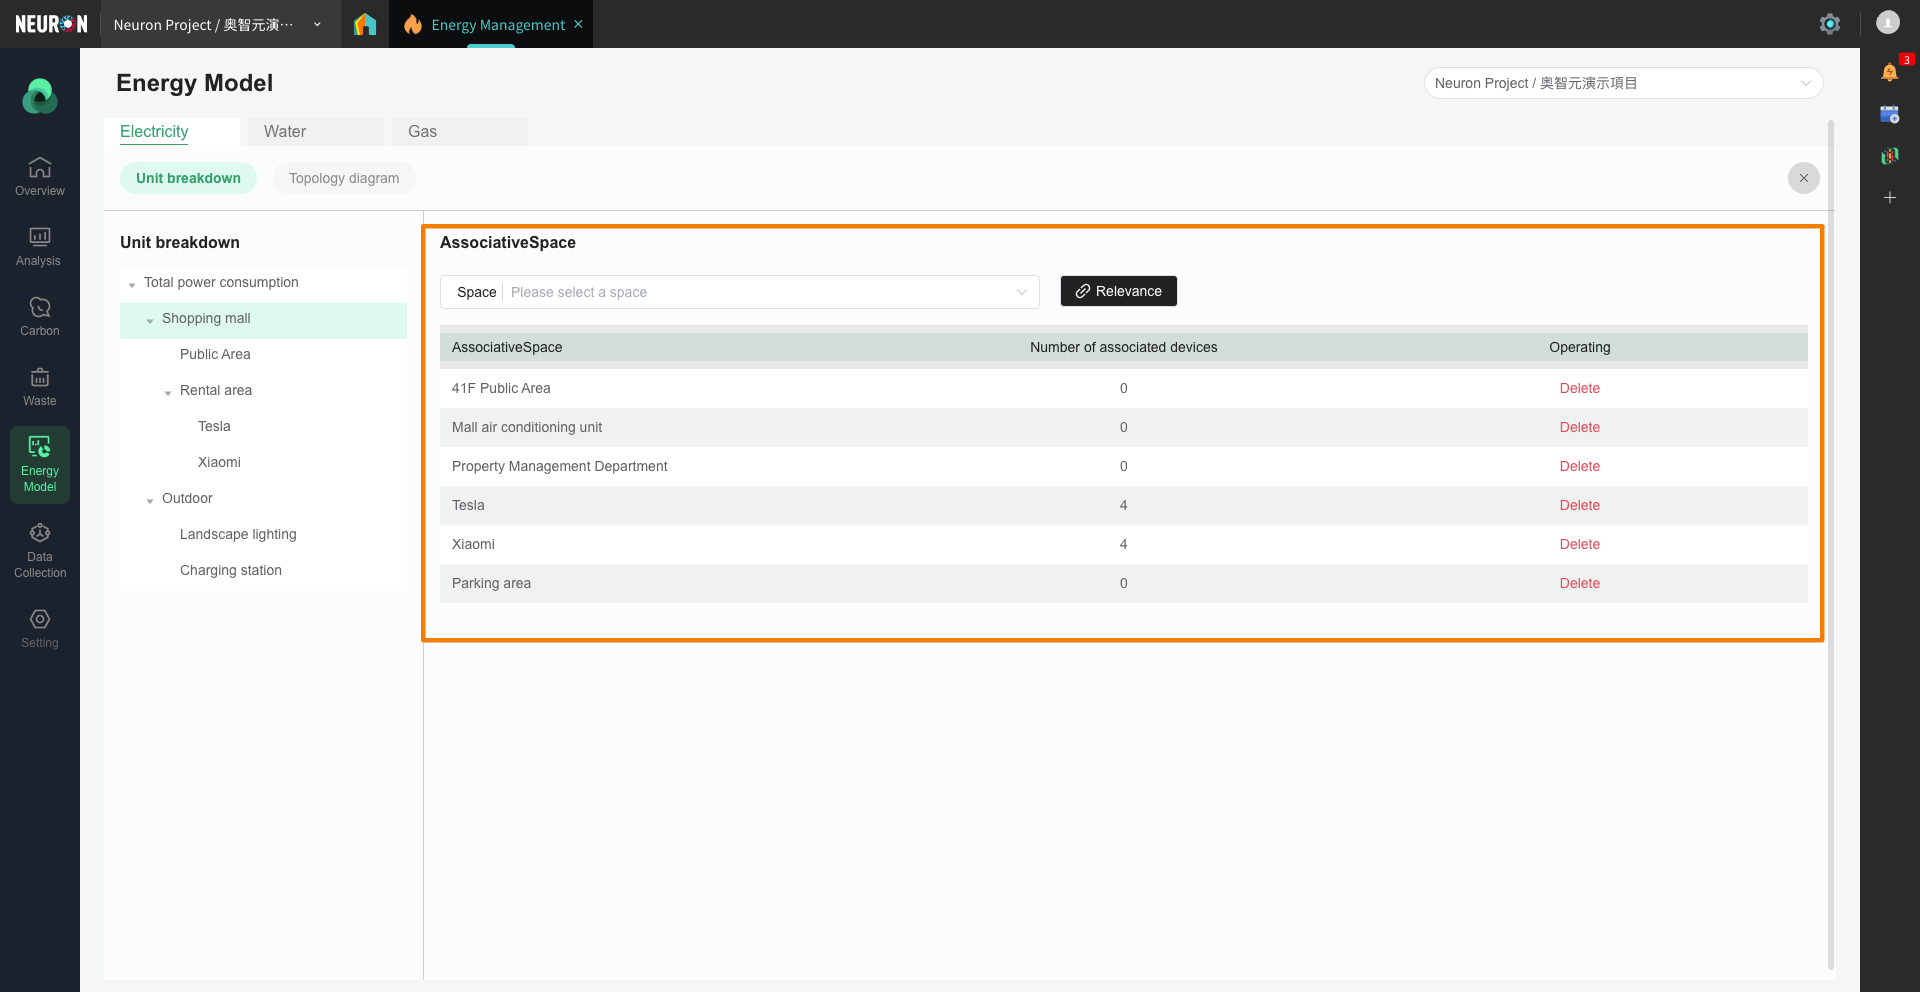
- Click the configuration button to configure the Space data associated with the current level.
Analysis
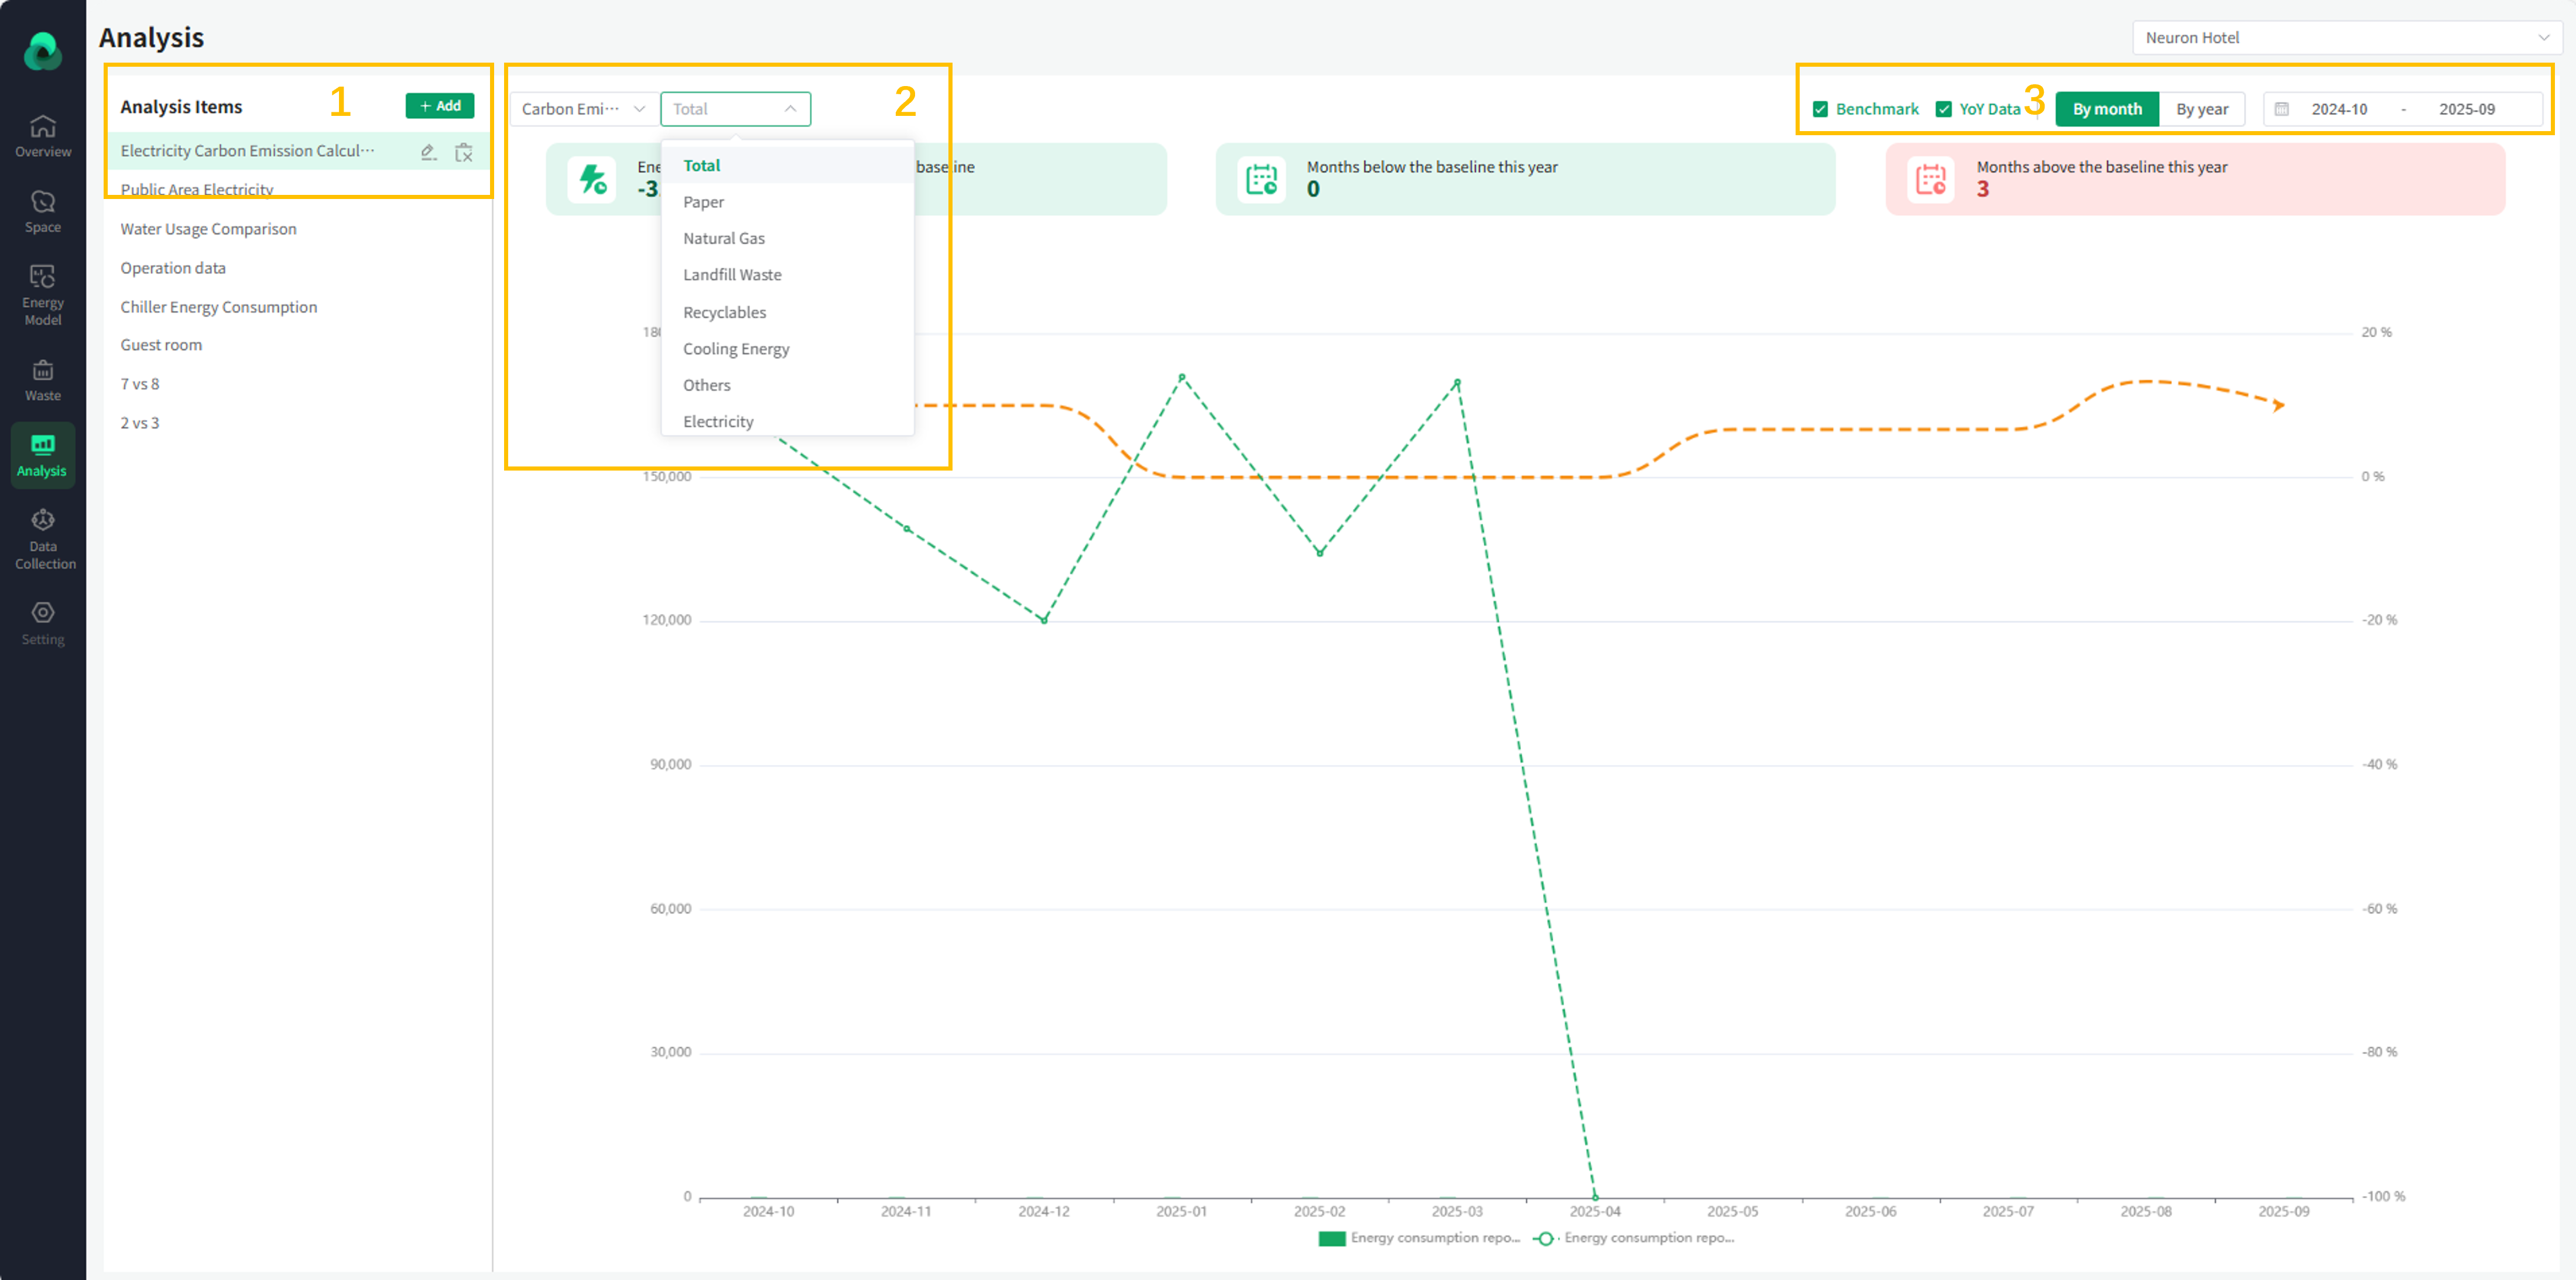
On the Analysis page, you can configure combinations according to your needs.
-
Users can add, delete, modify, and query analysis items, and also edit the Space data associated with the corresponding analysis items.
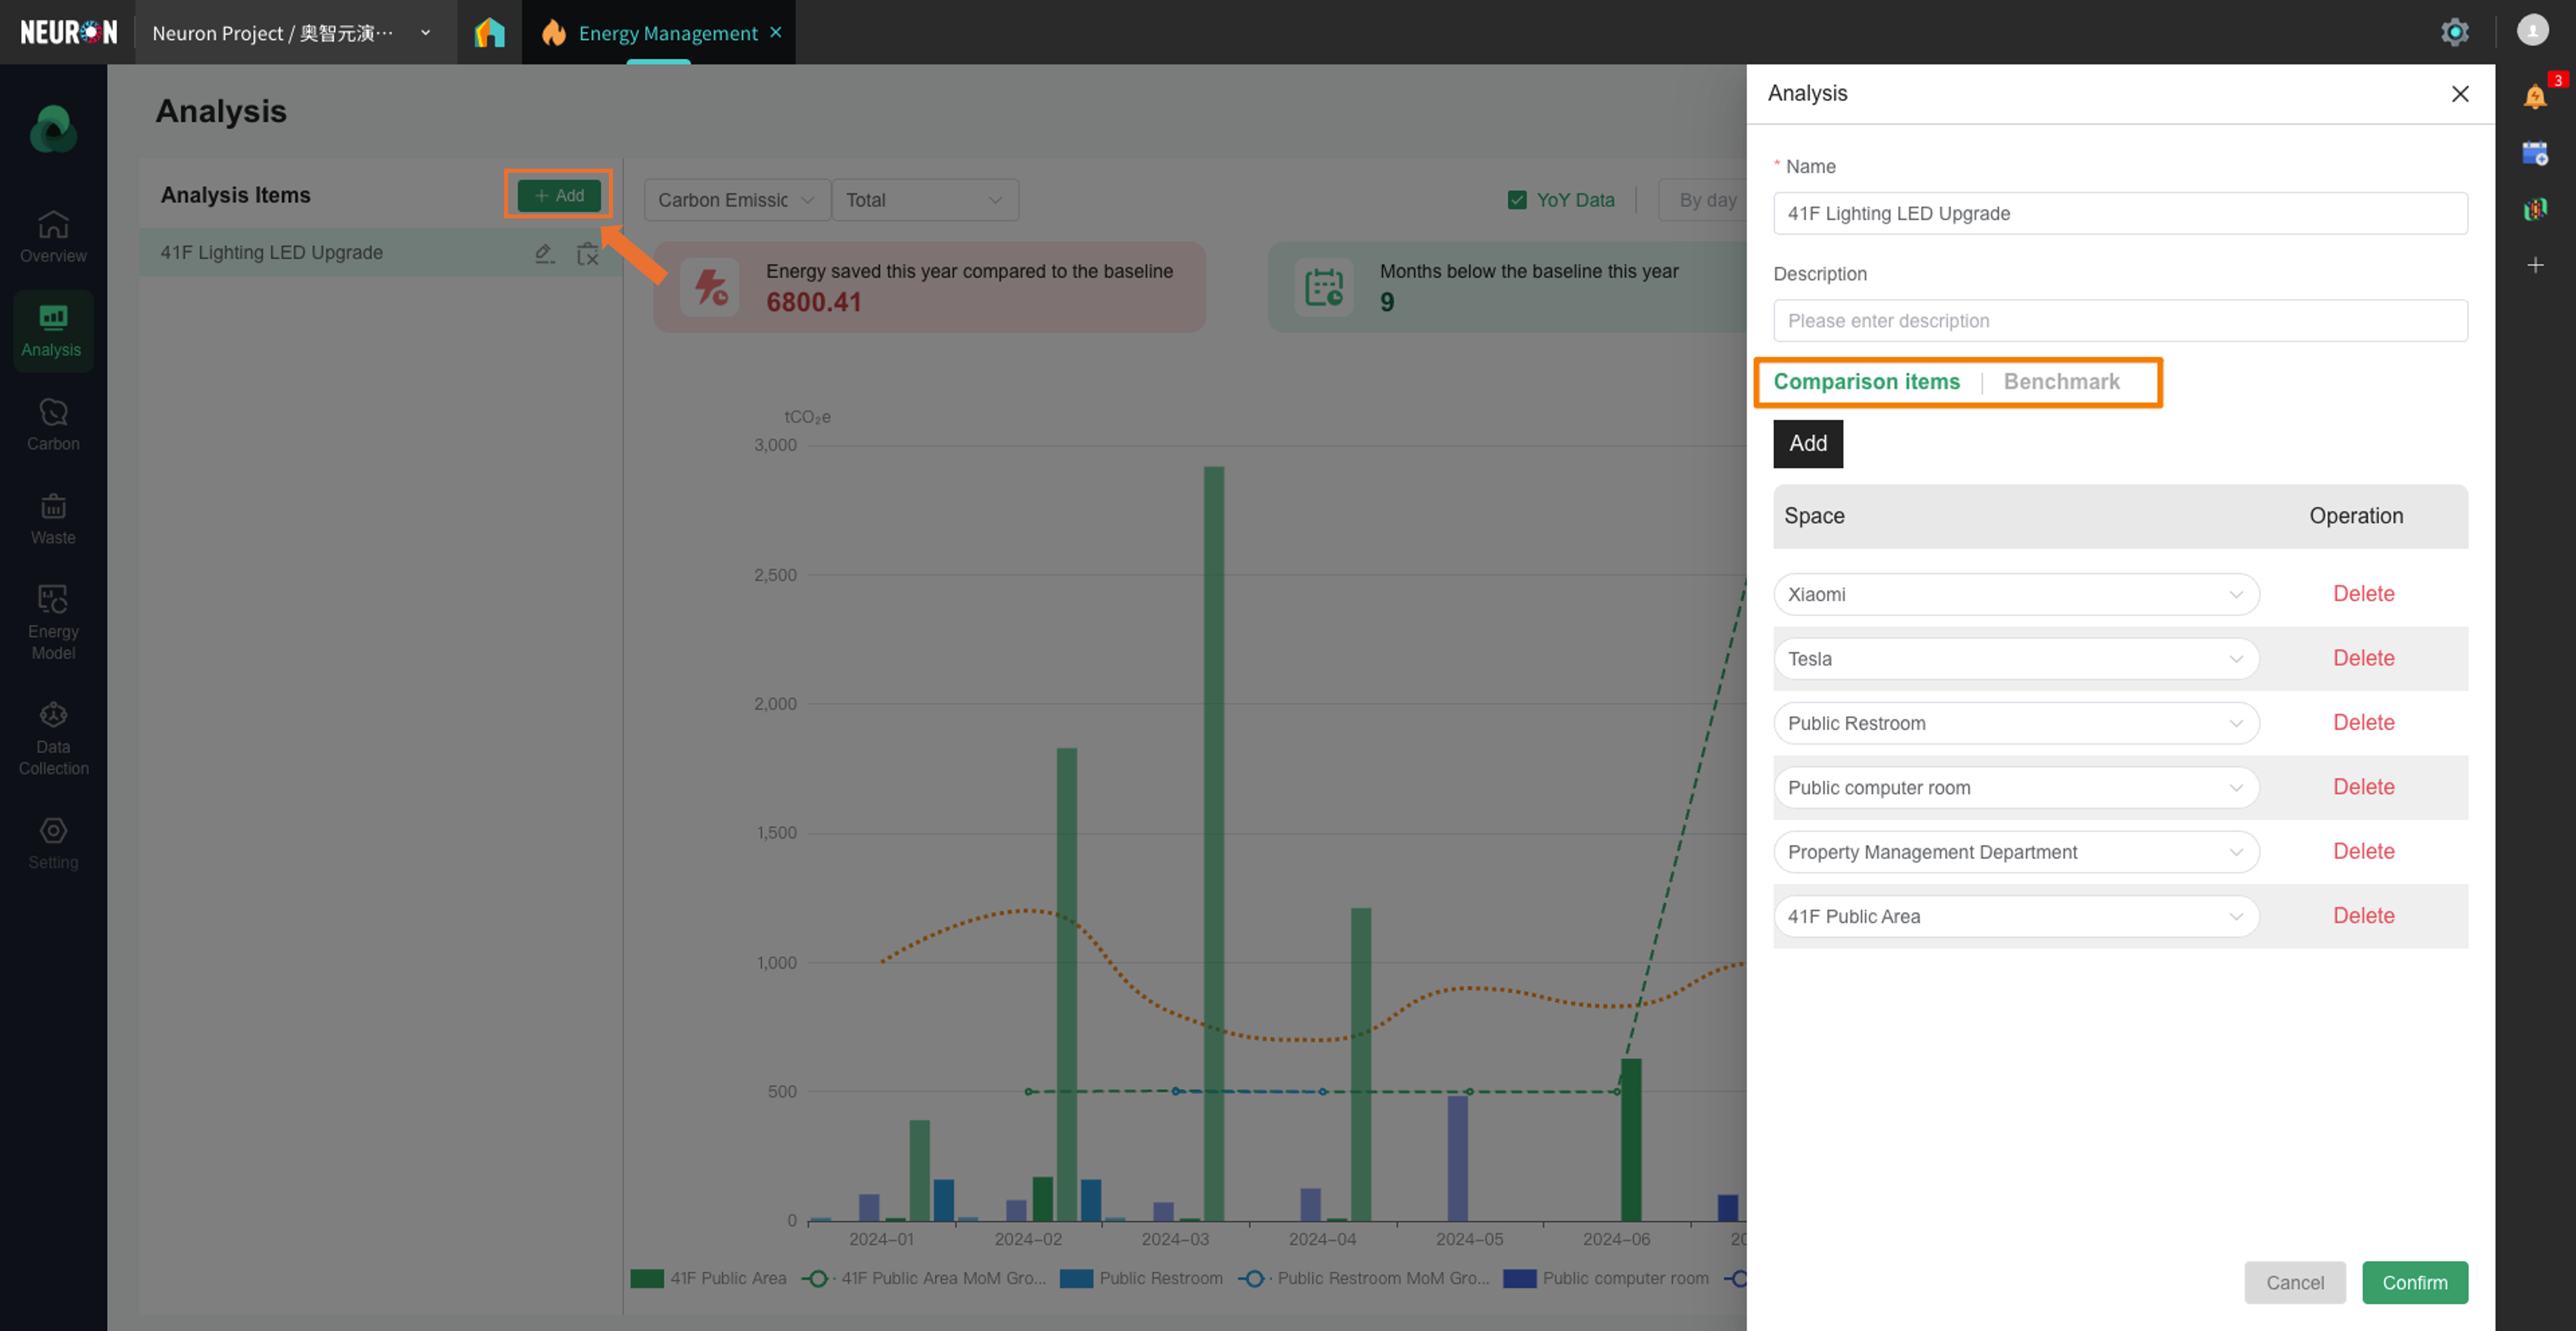 After clicking the Add button, fill in the name and description of the new analysis item in the pop-up window on the right, and then select the Spaces to be included in the analysis comparison.
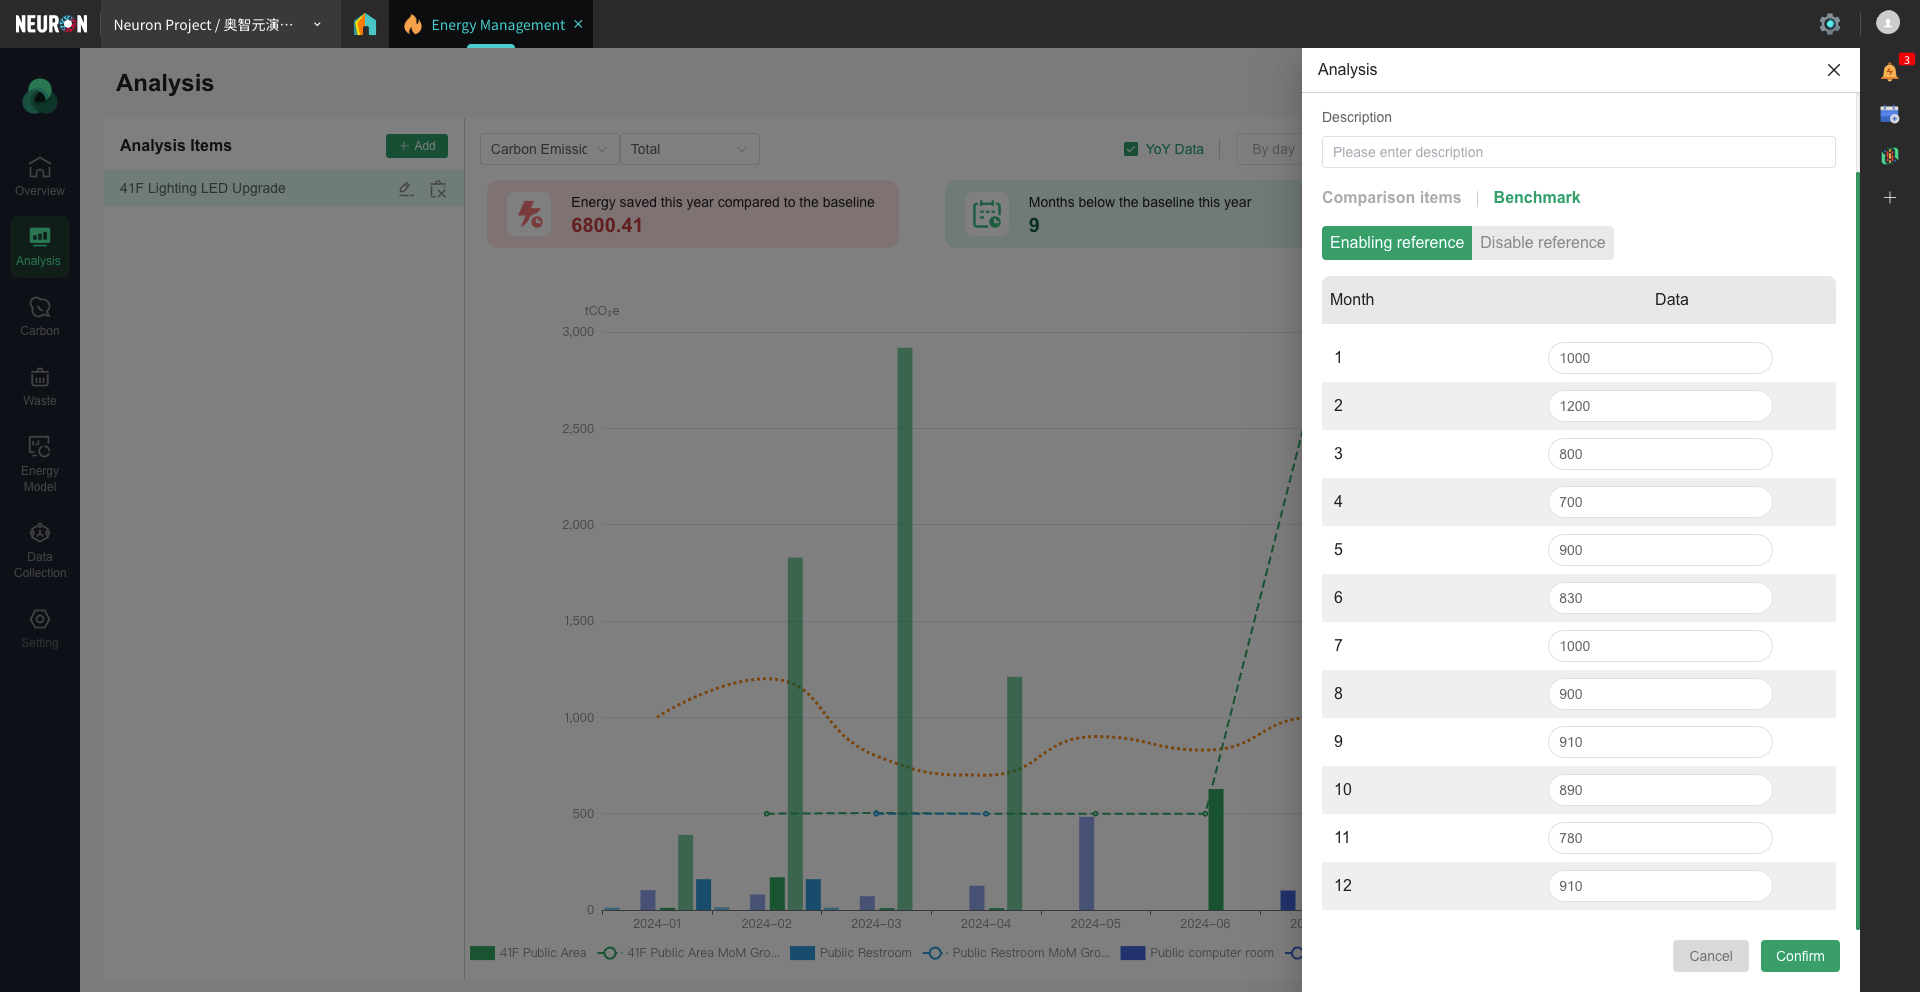 Additionally, you can set Benchmarks to add dimensions to the analysis. For example, setting a reference value in advance for each month. This value will appear alongside the actual value in the generated charts for reference.
 -
After binding Spaces, we have the scope of the data source. To filter the data that needs to be displayed, there are two main categories: Data Type: raw data (including different energy data and waste data) and carbon emission data calculated based on the raw data (including different carbon emission sources).

-
Supports displaying current data, month-over-month (MoM) data, year-over-year (YoY) data, and benchmark data. You can confirm the data range to be displayed using toggle buttons and time selection.
Reports
Report is also an important function of the energy module for data analysis. Its main form is downloadable Excel spreadsheets, which can be used for regular reporting or further calculations.
-
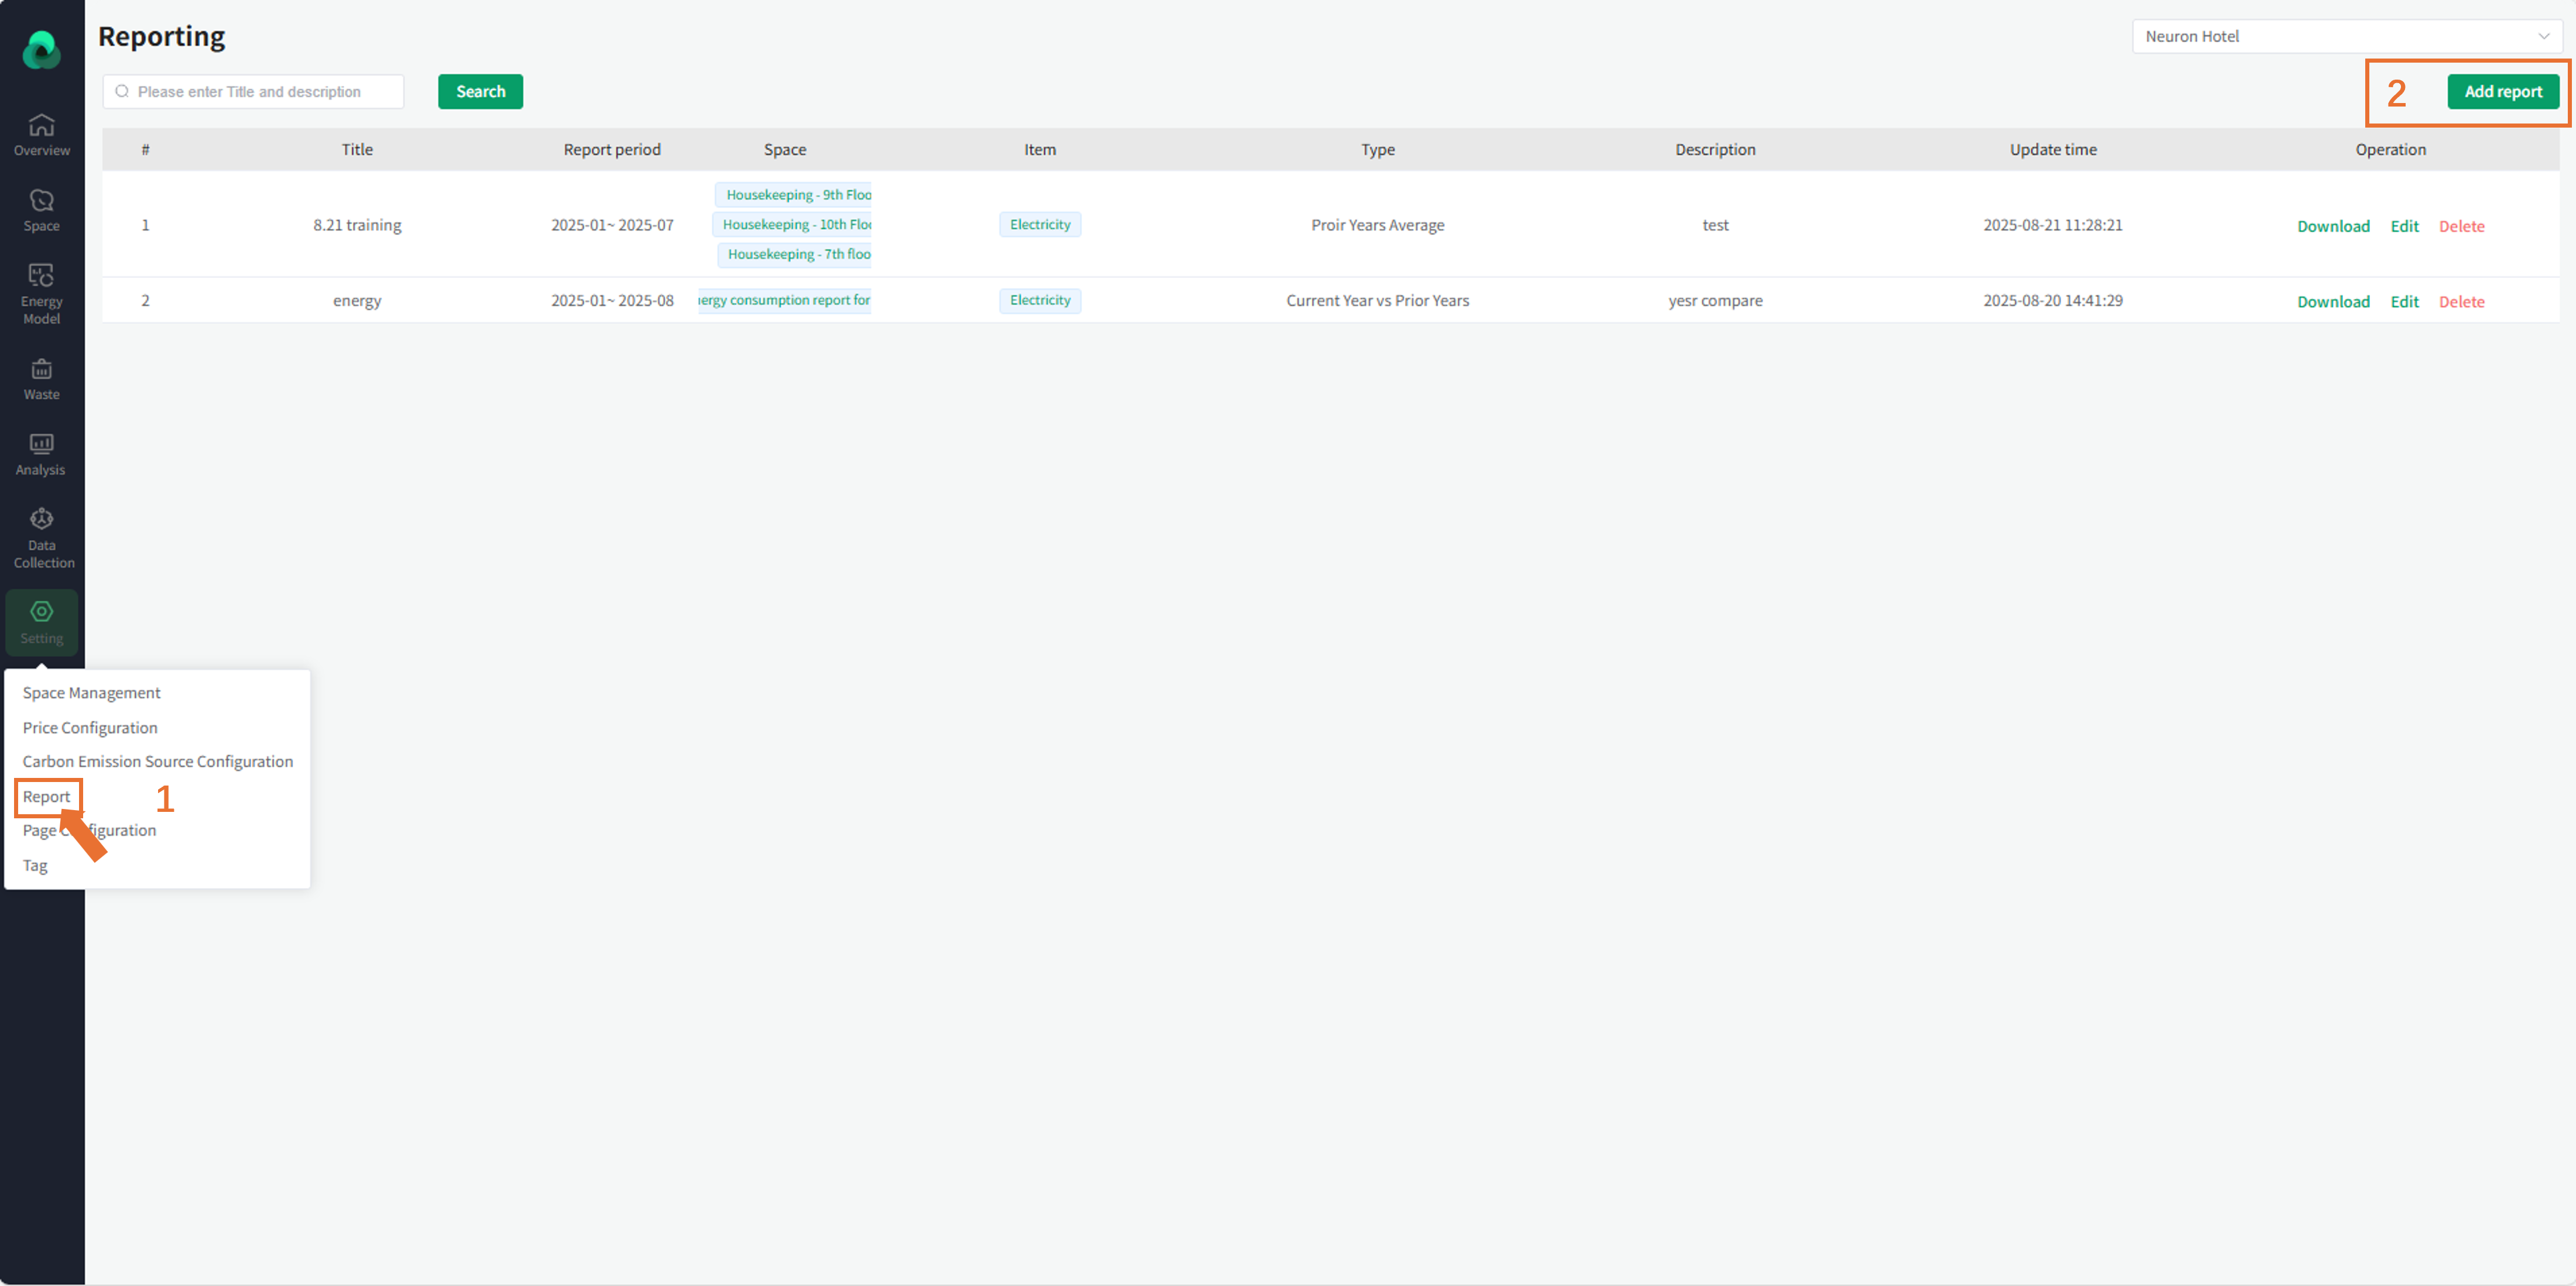
Click the left menu bar and open it under the bottom 'Setting'.
-
Click the 'Add report' button to open a pop-up window and fill in the relevant data.
-
Configure the report title, the Spaces related to the report (multiple selection supported), the data types related to the report, and the time span of the report. It also supports users selecting the year for data comparison.
Note: When the comparison year is 1, the report directly compares data from (selected time span year - 1). When the comparison year is greater than 1, it will average the data from previous years for comparison.
